Insights
Excel: Dynamic Column Reference in a Financial Model
This video explains how to use SUMIF and the INDEX + MATCH function combination in Excel to dynamically reference columns in a financial model. This has been particularly useful to me when I am organizing a company’s data by location or product category.
Excel for Models: =SUMIF() Introduction
This video provides a quick introduction to the =SUMIF() function in Microsoft Excel. The video also provides a quick demonstration of what is likely the most common use of =SUMIF() in a financial model: organizing monthly information into quarters and annual periods (skip to 1:15 for this example).
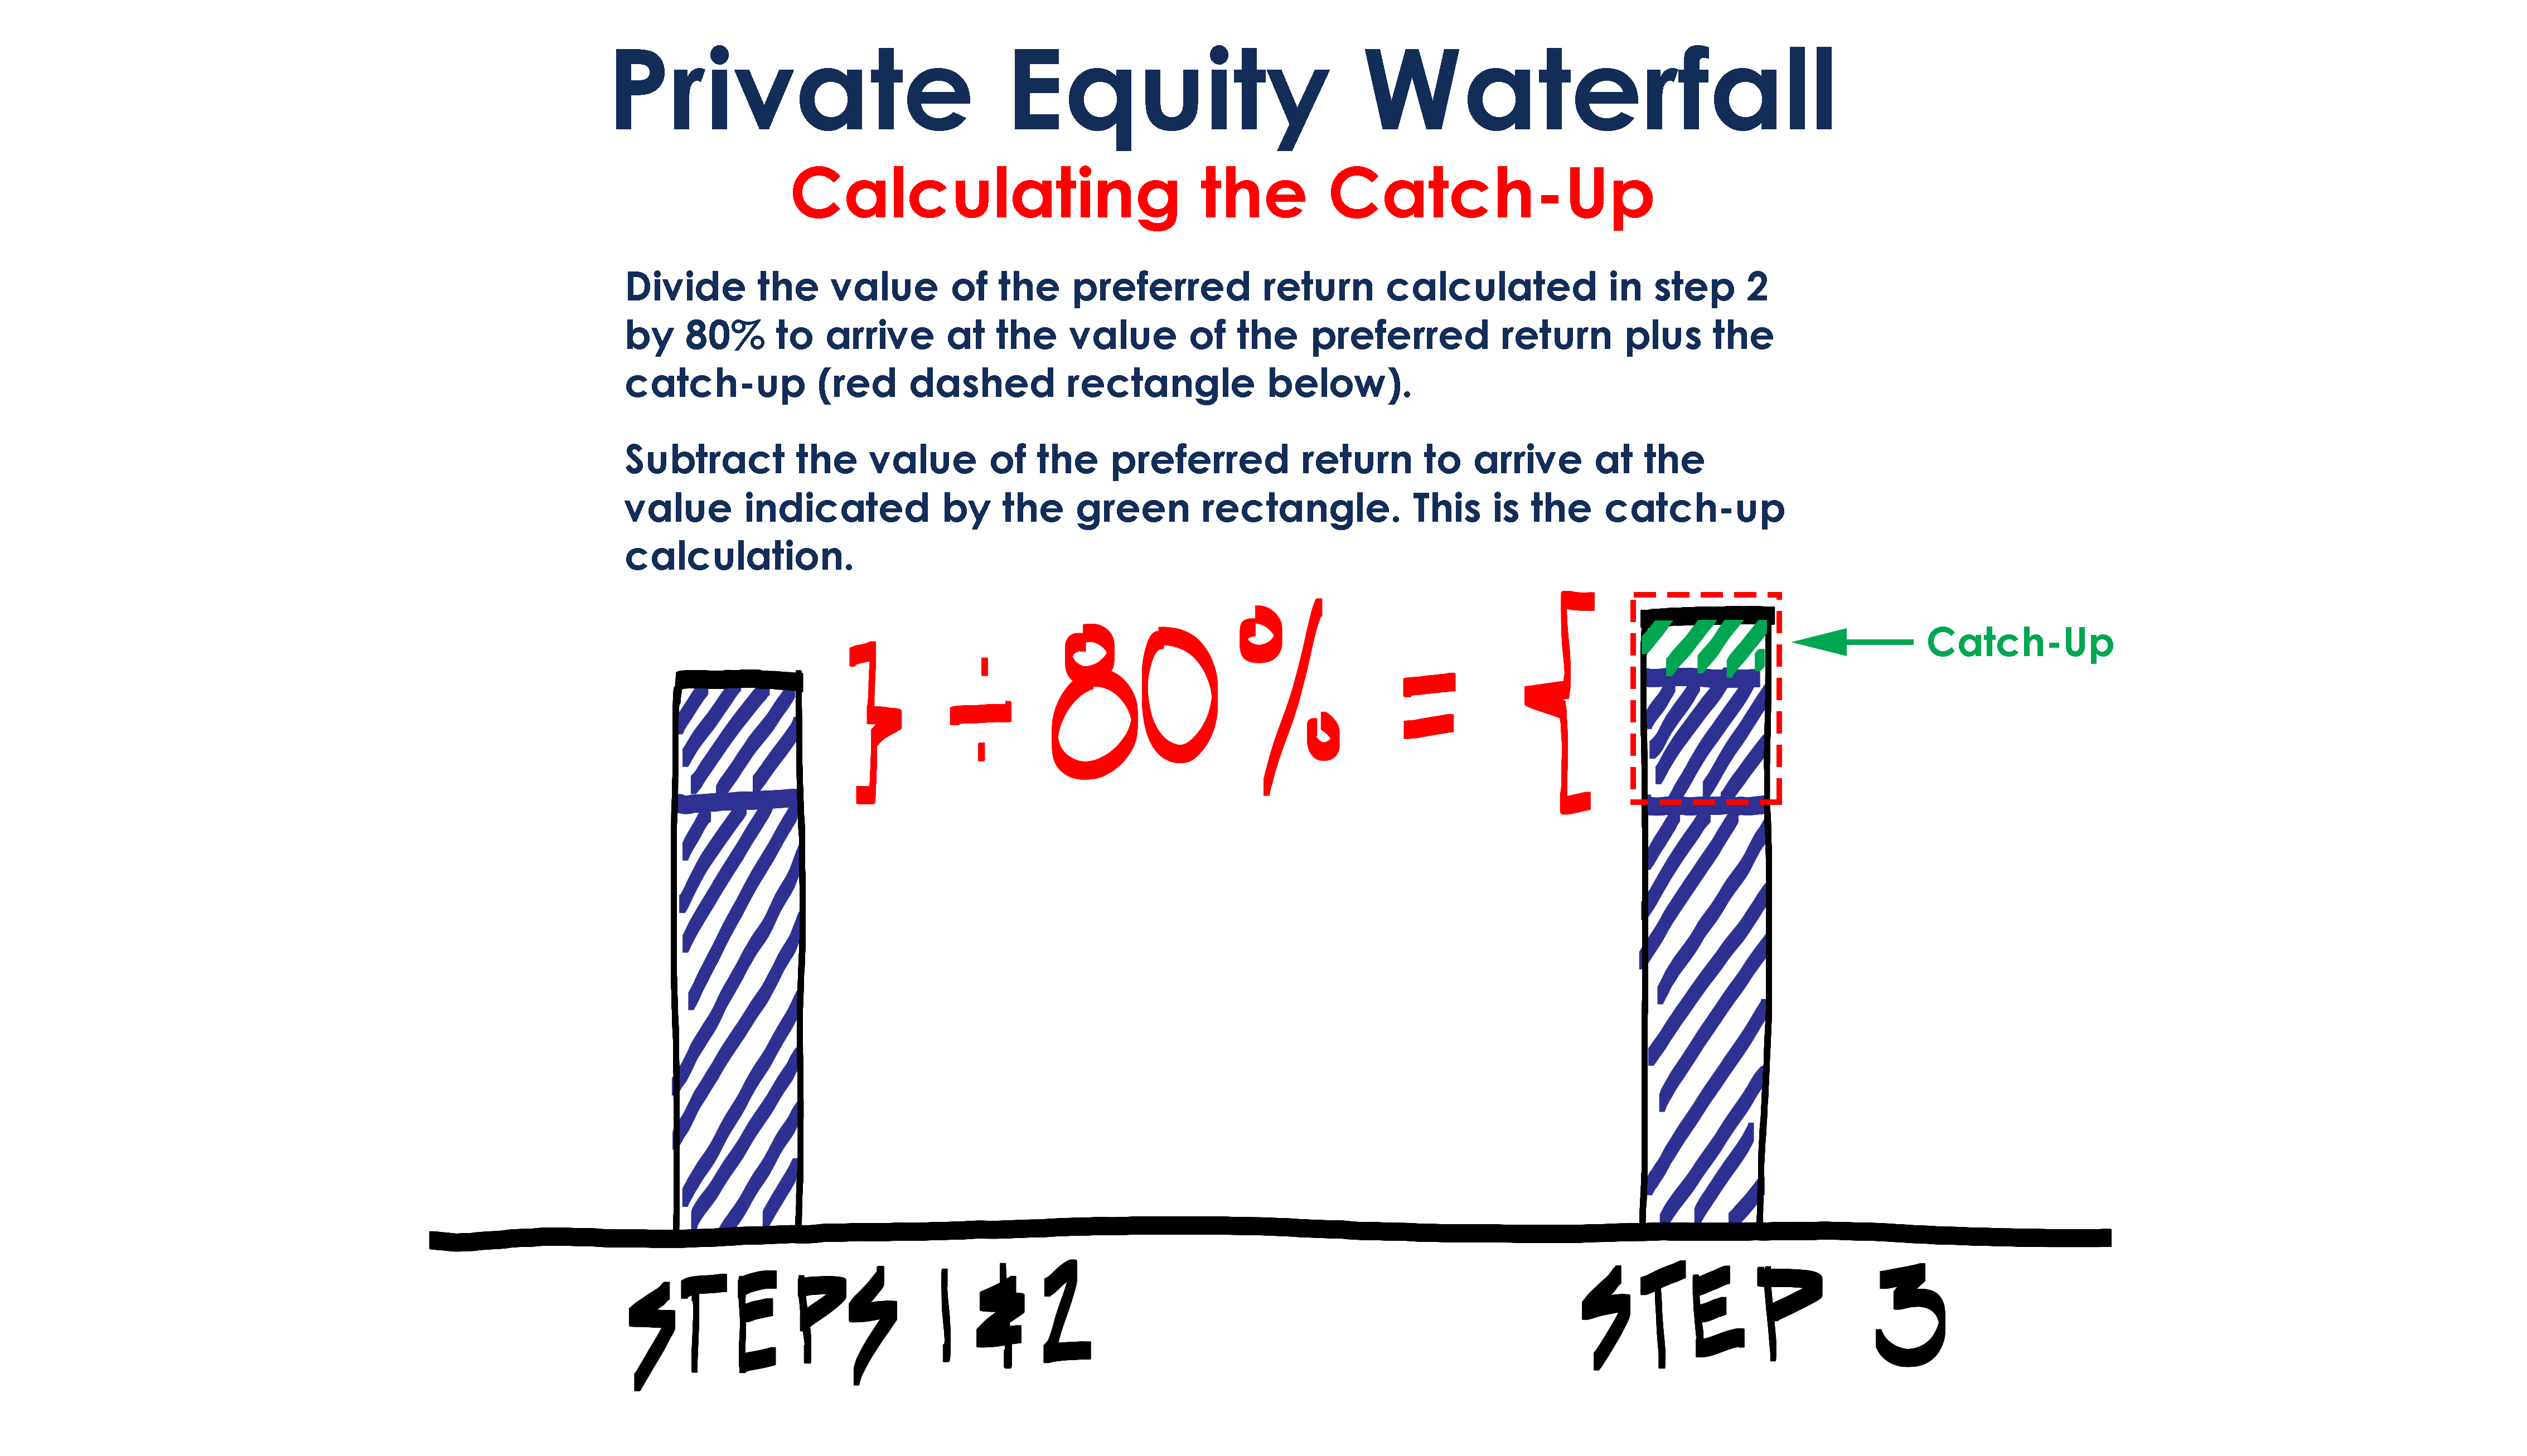
Private Equity Catch Up Calculation

The calculation behind the catch-up provision that determines the general partner’s (GP) carried interest at a private equity fund can cause some confusion. In this post we will explain the math in the Excel template available on ASM.
Who Invented EBITDA?
EBITDA is often criticized as an imperfect measure of earnings to use broadly in comparing the profitability of companies across industries. But the concept wasn’t developed for this purpose. It was invented by billionaire investor John Malone.
Real Estate Distribution Waterfall Example
I have been working with a friend of mine who prefers to remain anonymous and happens to be a real estate professional to develop a simple real estate distribution waterfall (I will refer to him as Dimitri for the purpose of this post). Our working relationship consists of me interrupting his day with short emails containing Excel templates and bulleted questions, which he graciously responds to with quick answers pulling from years of experience. It’s a highly iterative process that hopefully consumes little of his time.