Insights
Contrarian Investing Example: Uranium
In this article we explore an example contrarian investment thesis using Segra Capital’s bet on the price of uranium.
Pitching a Startup

This post addresses financial topics that I frequently find are missing in an early-stage investor deck. What follows applies largely to investment proposals for companies with $250 thousand to $5 million of revenue that are not yet profitable.
Entrepreneur vs. Employee

This article was originally published on Quora in response to the question, “What is the difference between a businessman and an entrepreneur?” It was later republished by Inc., Forbes and HuffPost.
The Private Credit Business Development Role

My friend Ryan Mullins joined Elm Park Capital (EPC), a private credit fund, in March of 2016 tasked with the objective of developing a dedicated business development role. As Mullins points out in this ASM interview, this was not common practice at the time. Investment firms in the lower middle market and middle market did not typically have dedicated sourcing roles, but the market was growing far more competitive.
Return the Last Non-Empty Value in a Row or Column in Excel
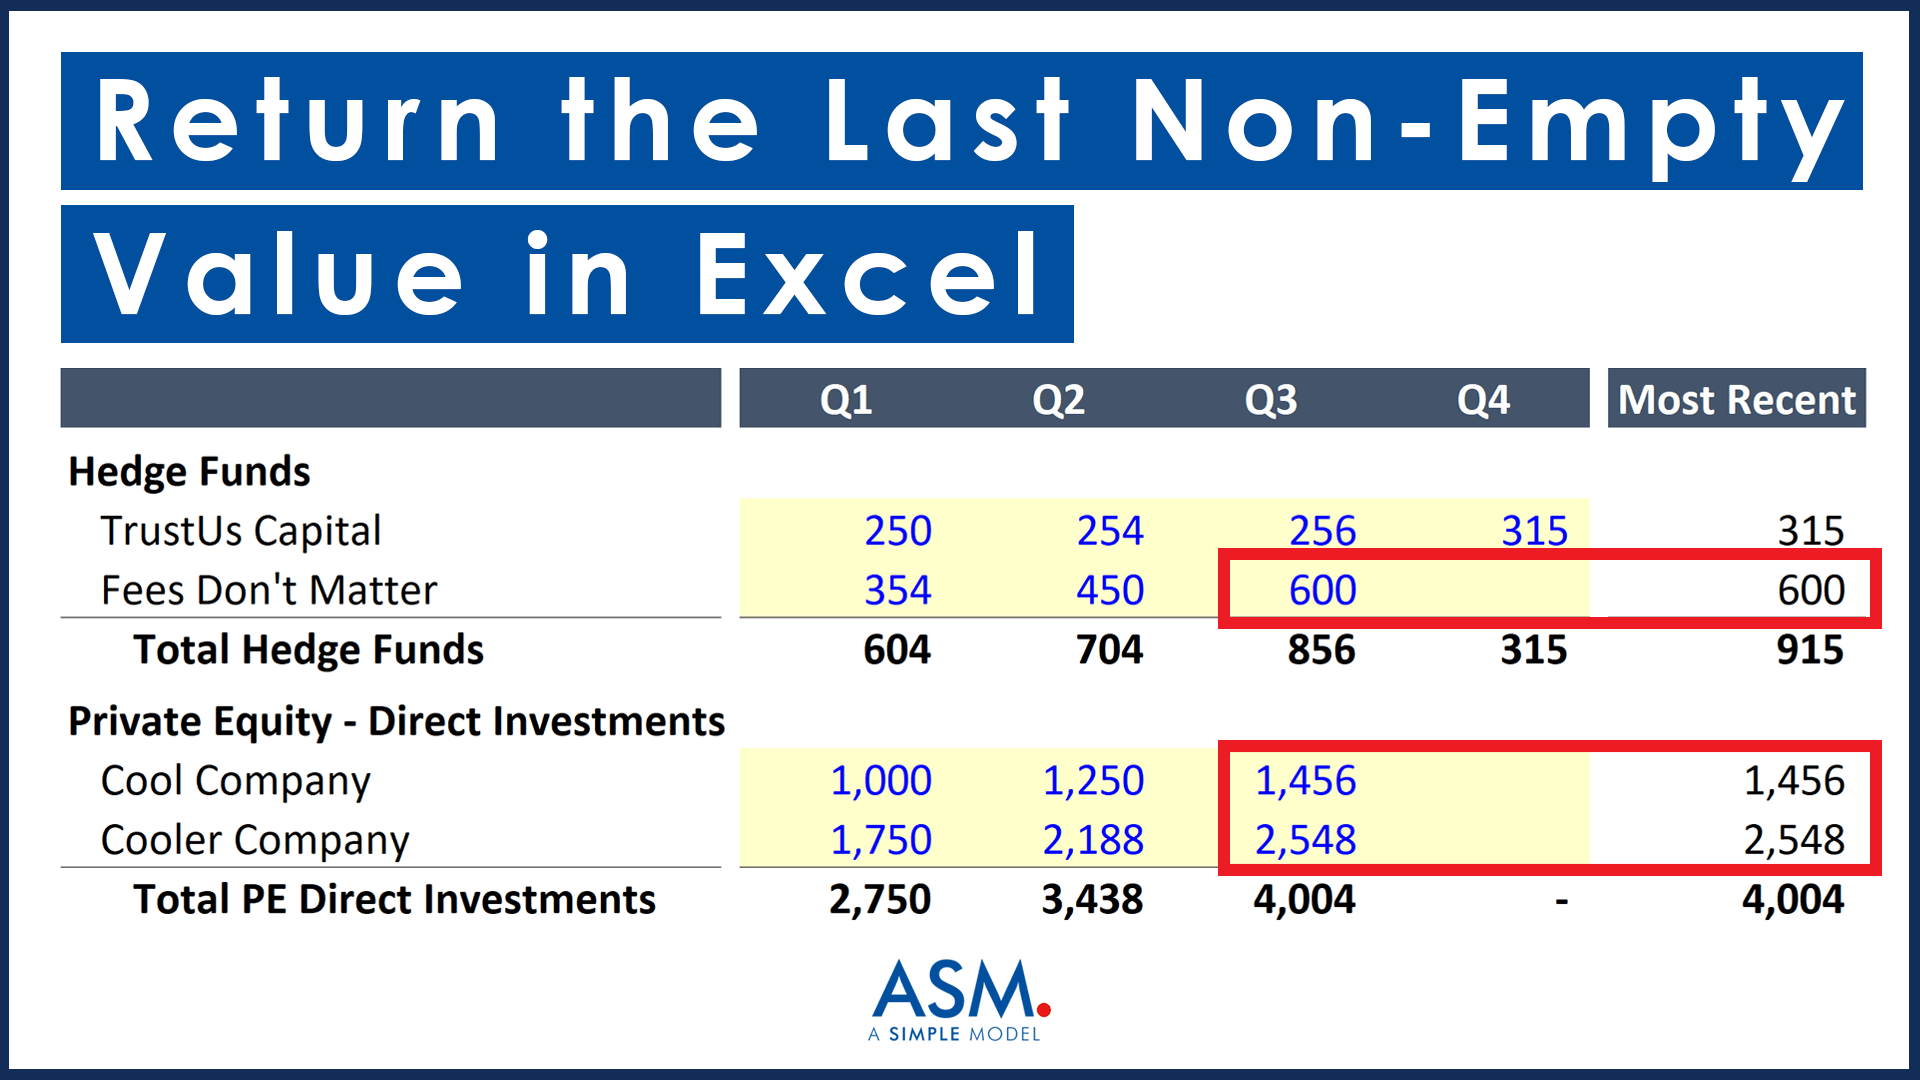
Get the last non-empty cell value in a row or column in Excel. This post includes a video and Excel template for download.