What is Private Equity: The Right Amount of Debt

This video is Part 3 of an introduction to private equity. In this video we will explore how to determine the appropriate amount of leverage for a target investment.

DEBT RATIO ANALYSIS
 
In a control private equity transaction, debt is commonly employed to acquire a business. This debt creates obligations of interest and principal payments that are due on a timely basis. If these payments are not made creditors can take action to recover the sums borrowed by the company.
 
For this reason much of the financial analysis involved in underwriting a transaction will focus on the company’s ability to make timely interest and principal payments. The degree to which a company’s performance can decline while maintaining its debt obligations is an indication of safety. For example, if a company can continue to meet its debt obligations even if revenue declines by as much as 25% it might make investors more confident.
 
To measure this flexibility, a company will be modeled under various scenarios with debt ratios for each projected period. This permits evaluating the business under a variety of different capital structures. On a most superficial basis, debt ratio analysis revolves around a comparison of liquidity or measure of profitability and the debt-related obligations of a company. The video linked in this newsletter starts by introducing the debt-to-EBITDA ratio.
FIXED CHARGE COVERAGE RATIO
 
As the video demonstrates, however, EBITDA is not a good proxy for cash flow and the total debt balance fails to communicate what is required in each period to remain in compliance. The Fixed Charge Coverage Ratio (FCCR) is introduced as a solution to these shortcomings.
 
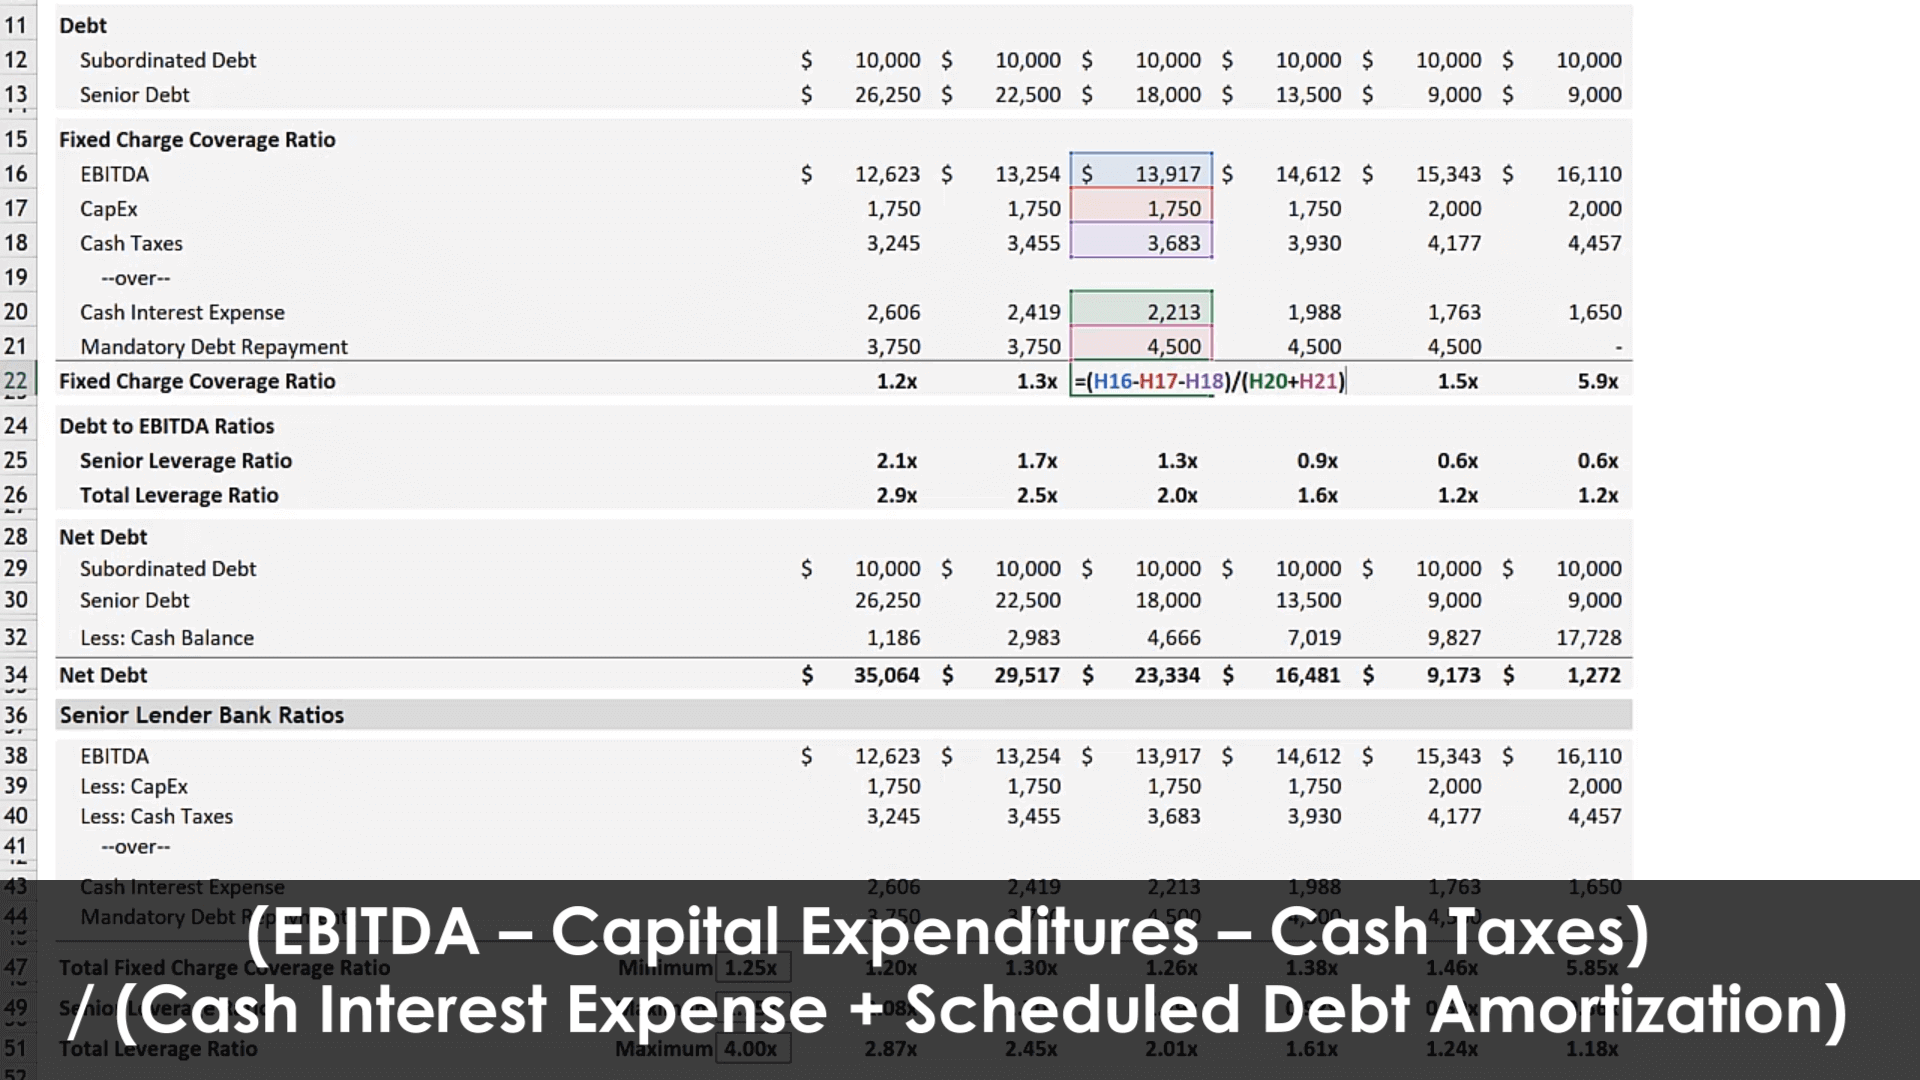
The fixed charge coverage ratio is used to measure a company’s ability to cover its “fixed charges” (largely debt-related payments but this can include additional obligations as you will see below) due in any given period. Below we will start with a simple visual and expand on this by including the definition a senior lender might use in a term sheet.
 
The Fixed Charge Coverage Ratio gets more precise by subtracting additional uses of cash from EBITDA to get to a closer approximation of cash flow for the period. The logic behind subtracting capital expenditures instead of depreciation and amortization (the “DA” in EBITDA) is that capital expenditures are a cash outflow whereas D&A are noncash items. After that, cash taxes are subtracted to arrive at a better approximation of cash flow. Interest expense is not subtracted, but it can be found in the denominator (interest expense is one of the “fixed charges”).
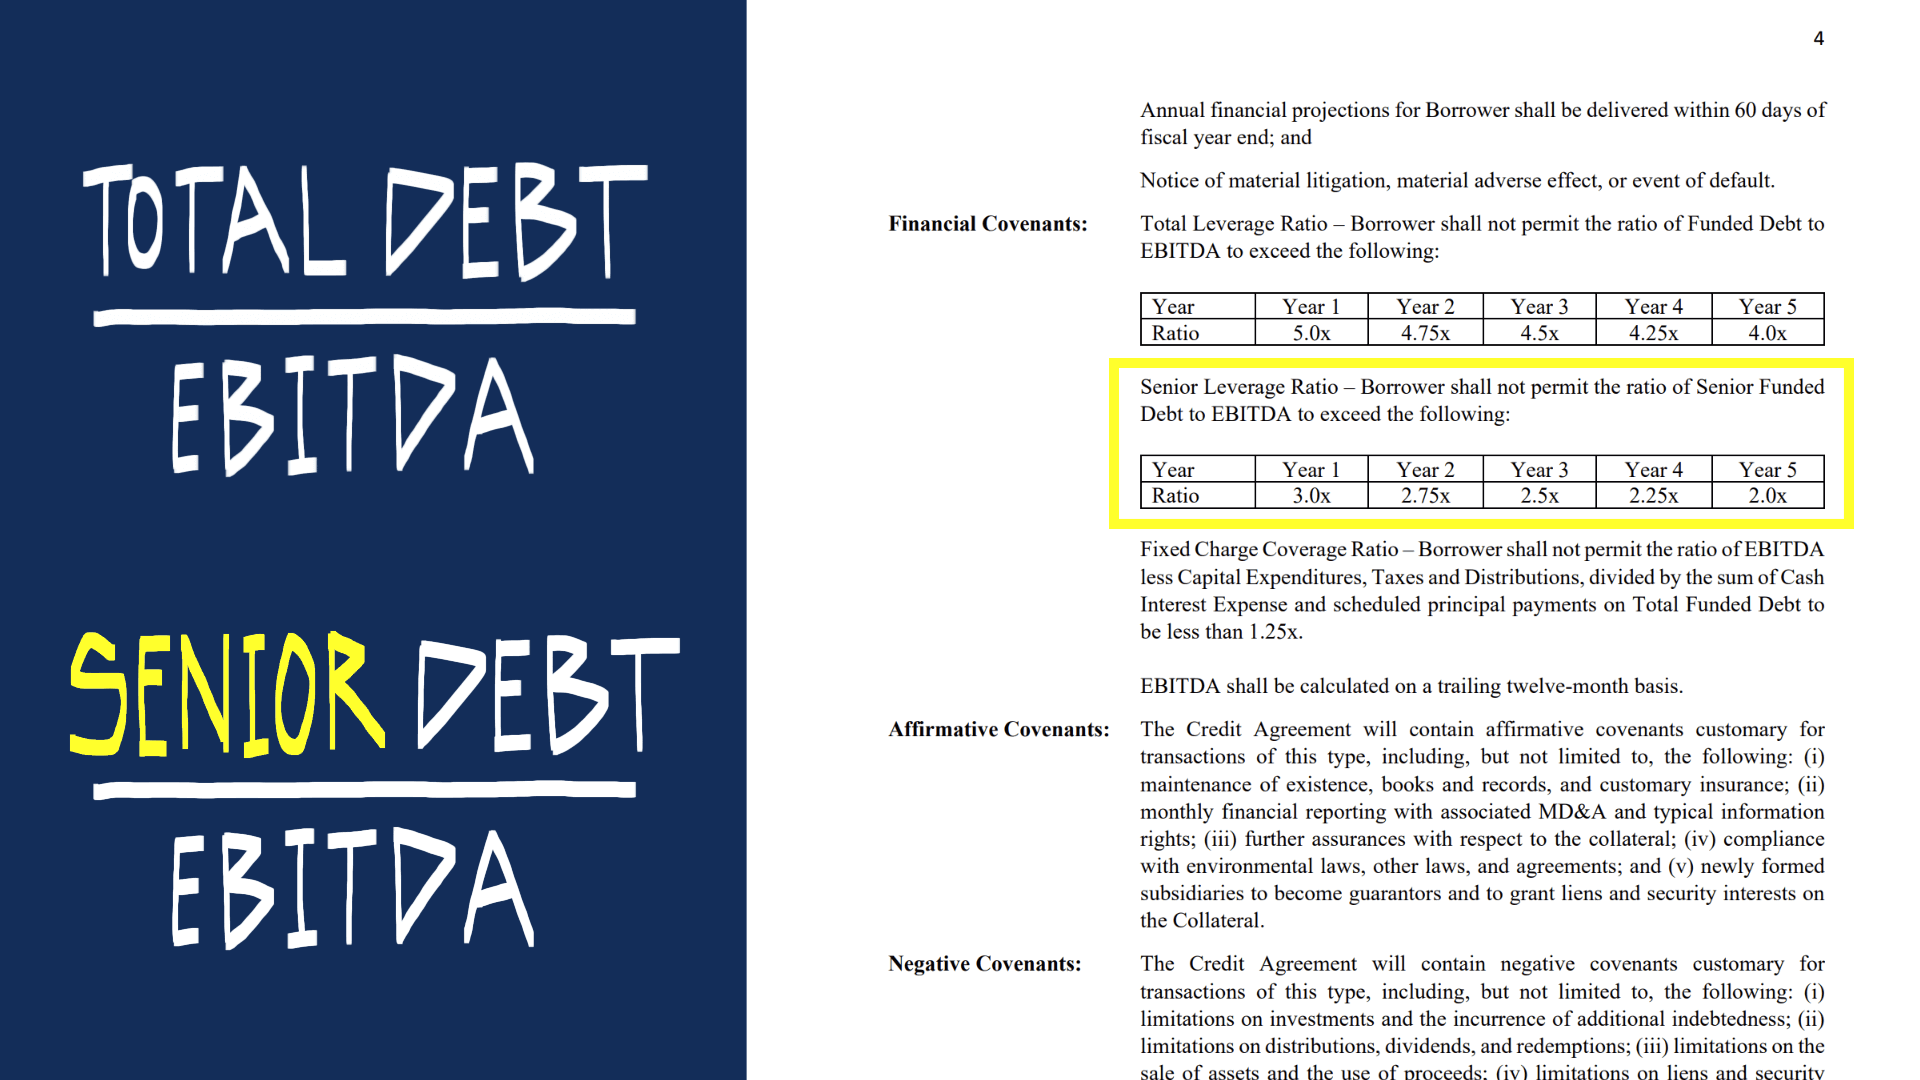
To elaborate on the denominator, rather than reference gross debt, this calculation looks at the actual cash required to remain in compliance in each period. Since you are more closely comparing the cash available for debt payments to the debt payments required in each period, a lender typically requires that this ratio remain above a minimum threshold of 1.2x.
Example of what you might find in a senior debt term sheet:
“Fixed Charge Coverage Ratio – Borrower shall not permit the ratio of (a) EBITDA minus the sum of (i) capital expenditures (excluding financed or equity funded capital expenditures), (ii) taxes, (iii) distributions, divided by (b) the sum of (i) cash interest expense and (ii) scheduled principal payments on total funded debt (including capital lease payments) to be less than 1.25x.”
Introduction to Private Equity Series: