An EBITDA multiple is, very simply, a company’s enterprise value (EV) divided by its EBITDA at a given time (EV / EBITDA); conversely, EV can be calculated by multiplying EBITDA by the EBITDA multiple. This metric has long been used as short-hand approach to a company’s valuation, and you will frequently hear individual deals or entire industries referred to as “an [X] times deal” or “an [X] times industry,” with X being a multiple of EBITDA.
EV / EBITDA quickly became the primary metric used by investors to evaluate, describe and benchmark leveraged buyouts in the 1980s, and it retains that title to this day. In most LBO models, cash flows and EBITDA growth are projected for five years, with an EBITDA multiple used to estimate enterprise value in the exit year. The underlying assumption is that the business is sold in the final year. In most instances, and certainly for most growing and healthy businesses, the sale generates the lion’s share of the proceeds to be distributed to investors (though in some cases dividends, refinancing, asset sales, or other cash generating events may also generate some portion of the proceeds).
For this reason – the critical importance of the event of sale, and thus the chosen exit multiple, in determining expected returns – it is generally frowned upon to use an exit multiple of EBITDA larger than the multiple paid on entry, especially if you cannot articulate why the investment is deserving of so-called “multiple expansion” (when secular changes in a business or industry justify higher multiples over time). But because the use of a higher exit multiple is one of the easiest ways to inflate returns and because multiples on private equity deals have generally been expanding over the past decade (for reasons we will expand on below), it can often be very tempting to bump your exit multiple up. Examining how multiples have expanded, however, provides a cautionary tale.
EBITDA Multiples in 2021
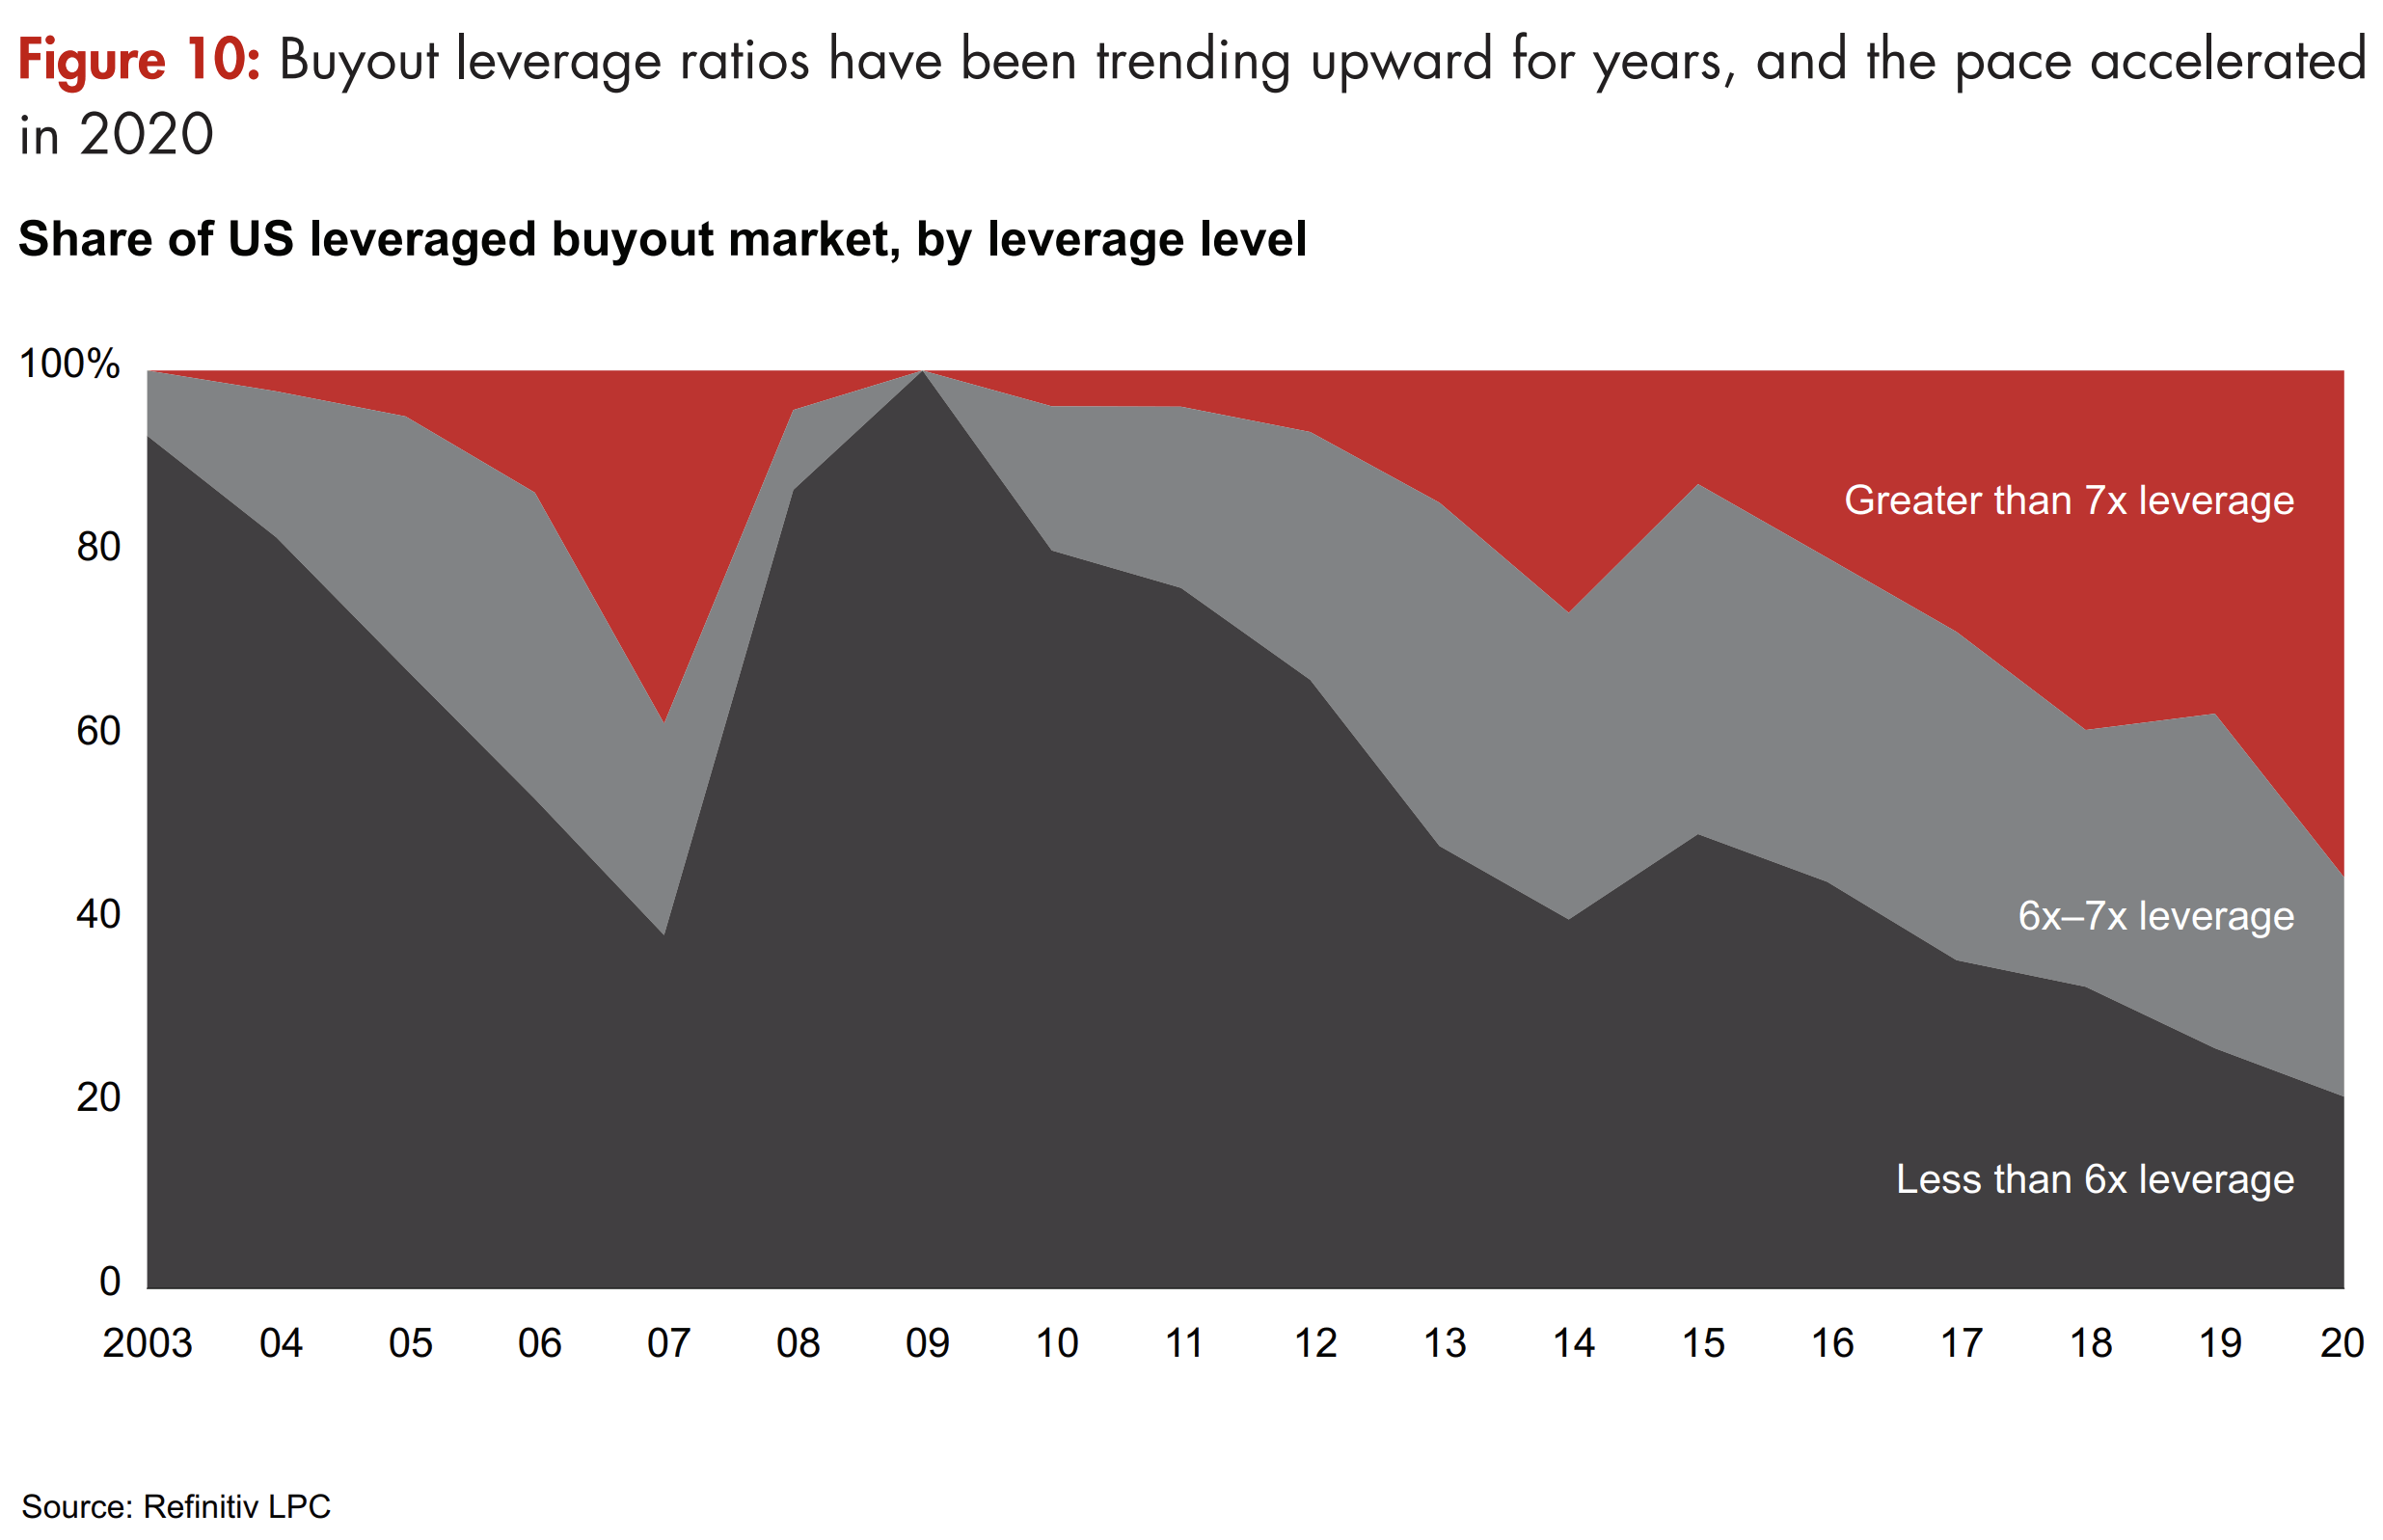
Per McKinsey & Co., the amount of leverage employed in U.S. buyouts is at an elevated level. The two-year trailing average stands at 7.0x EBITDA. That compares with 6.4x in 2007, just prior to the Great Recession. The Global Private Equity Report released by Bain & Company contains an infographic demonstrating an aggressive reversal from 2007 to 2009, in the depths of the financial crisis.

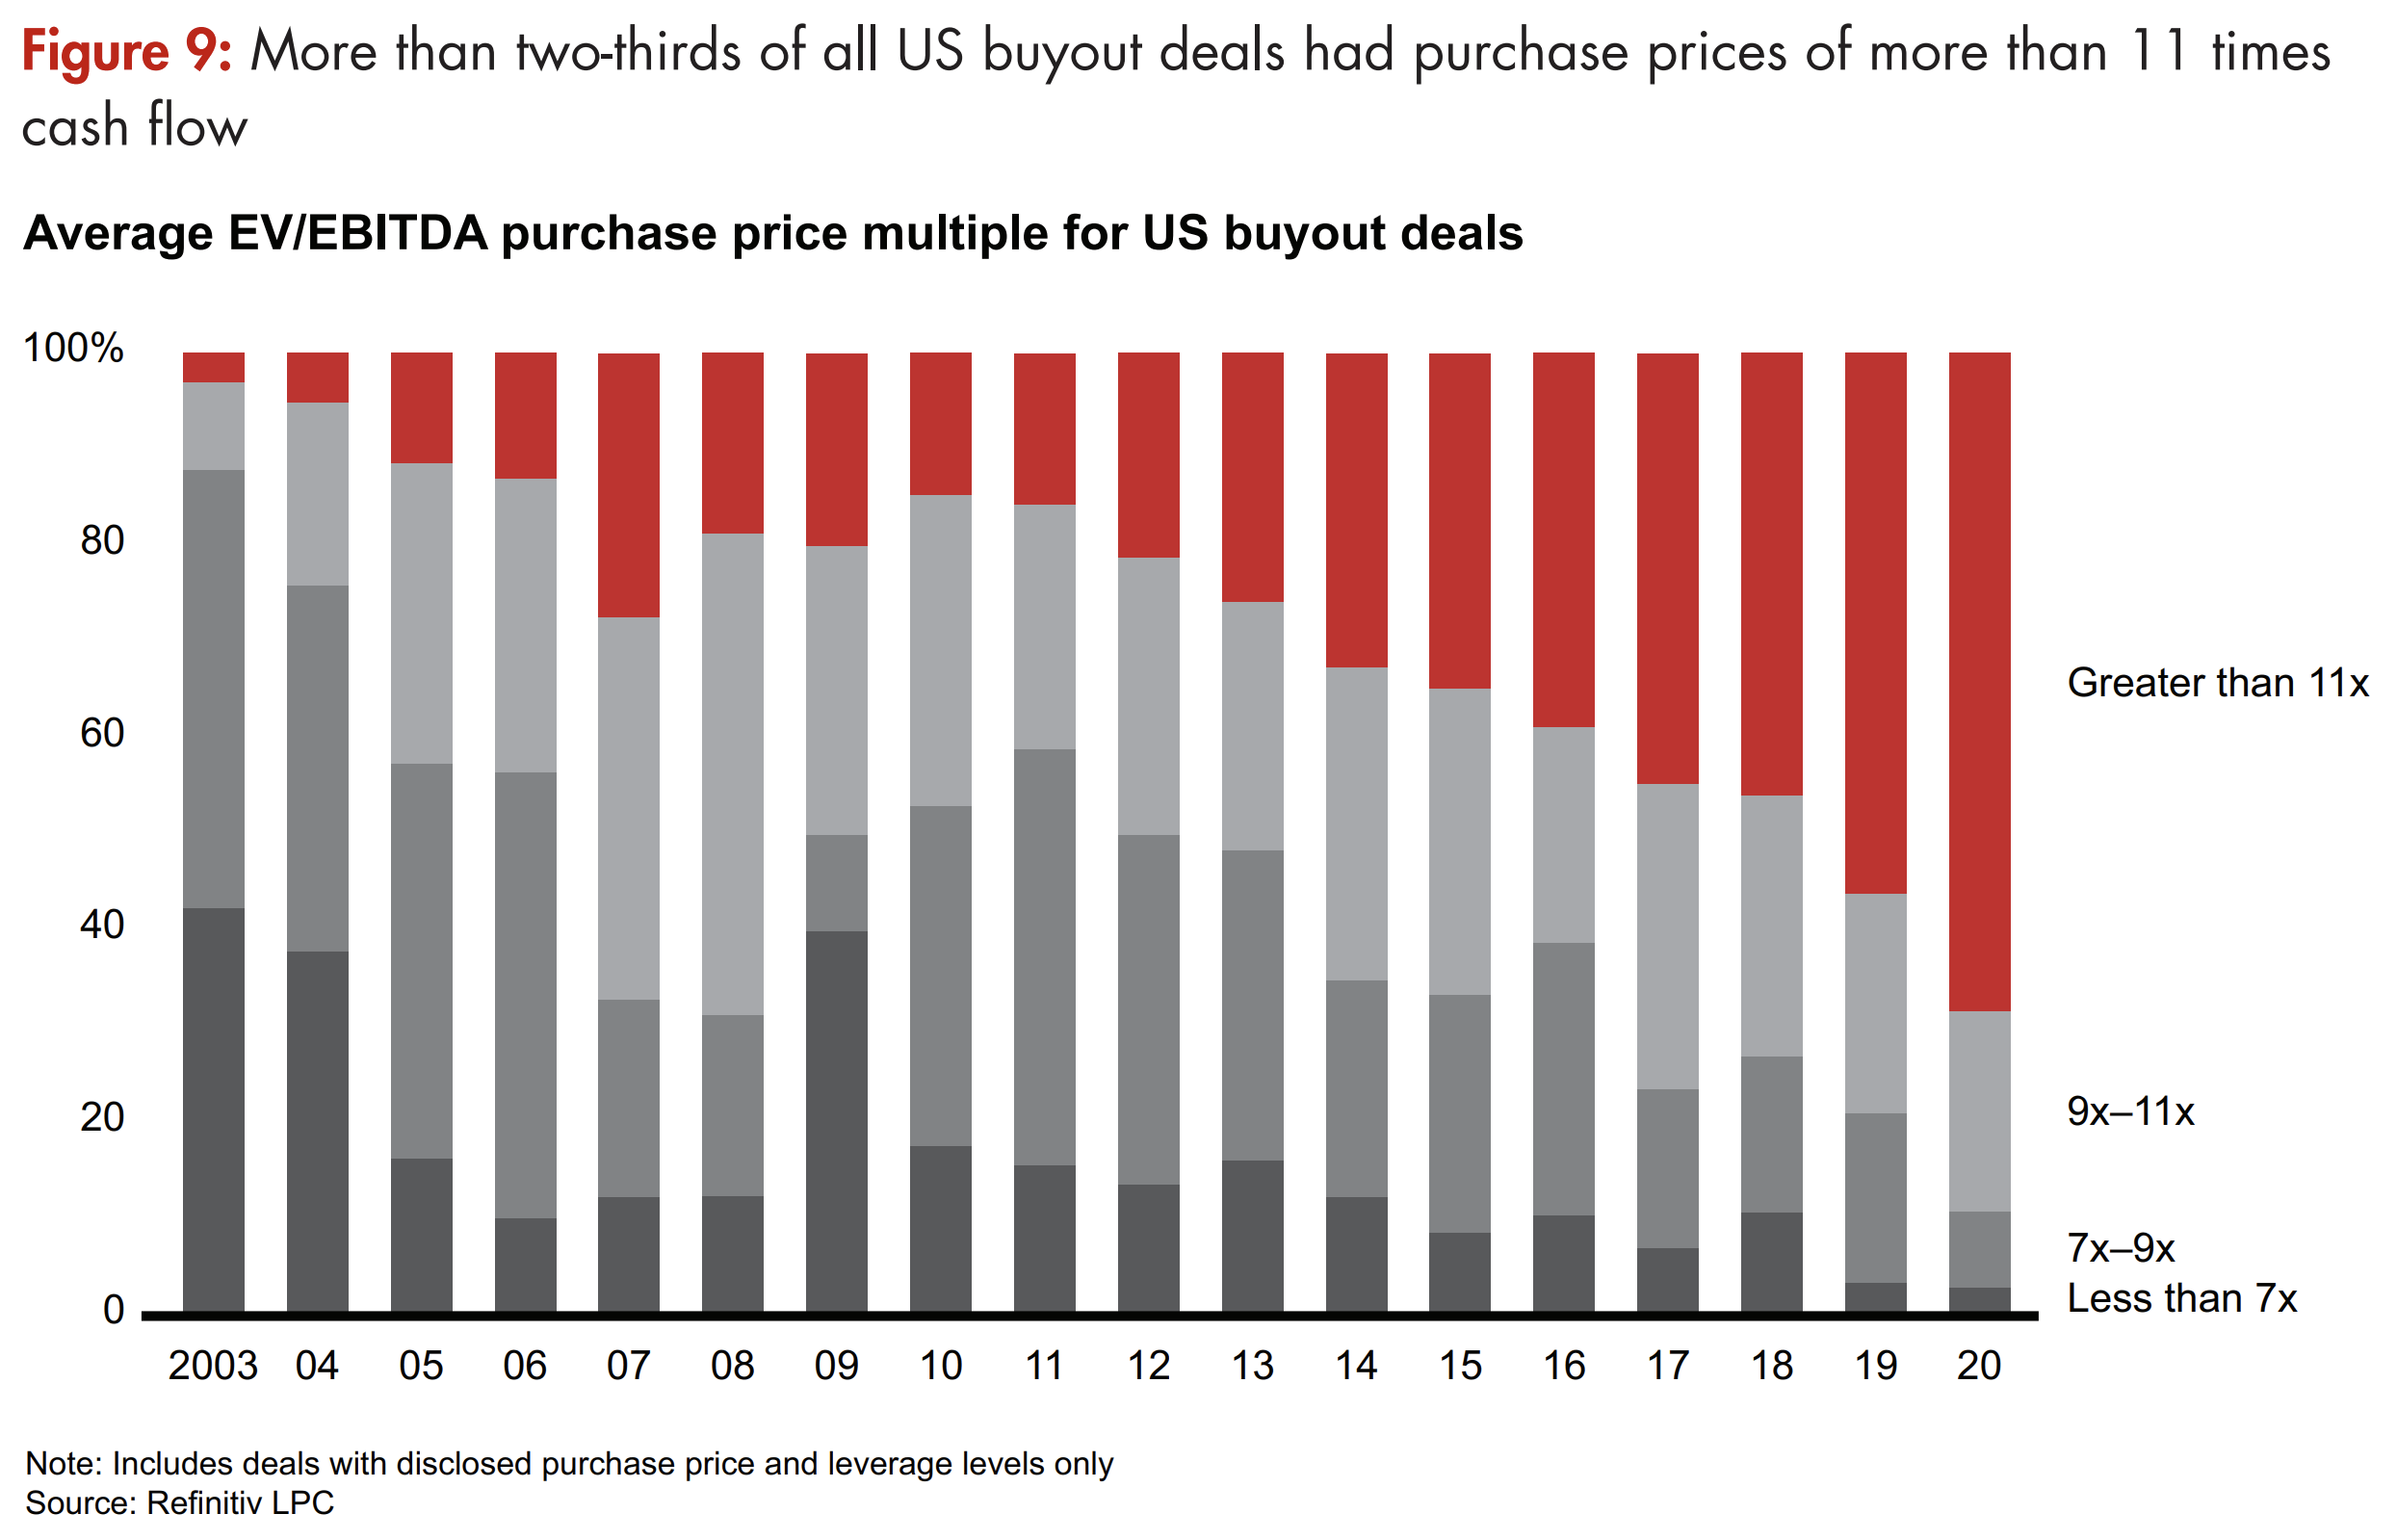
The article citing leverage multiples continues on with purchase price multiples, citing that the two-year trailing average multiple “reached a record 12.8 times EBITDA in 2020, compared with 9.4 times in 2007.” (The video above provides more detail on the variables driving valuations.)

“Graham reminded his readers that such ‘fantastic’ reasoning actually led to price-to-earnings rations of 50 and more. This generation does him one better. Bloomberg counts 253 American companies with price-to-sales ratios of 50 and higher.”
At some point history repeats, but persistently high-flying multiples and an accommodating Fed make it difficult to get too worked up 🙂 As investors, though, it’s important to make certain we aren’t lulled to sleep.
Suggested Reading: