Context: I recently received a message from a subscriber asking if I could explain the CAGR formula. He said that he had used it in one of his models, and when he looked it up online there was no explanation for the math. His response: “Welp, if you say so formula…” So I thought I would take a moment to explain the formula.
Q: Do you have an explanation for the CAGR formula?

A: First, for the unfamiliar, let’s define the Compound Annual Growth Rate (CAGR). CAGR is a simple metric that measures the average rate of growth of a sum, be that a figure like sales or an investment, over any number of periods. It’s easy to picture visually:

In Example 1 above, a $1.00 investment grows by 20% for three years to a value of $1.73. The CAGR is 20%. Now, as you can see in Example 2, even if the growth each year is uneven, because the CAGR formula uses only the ending and beginning values to calculate average growth, the result will be the same.
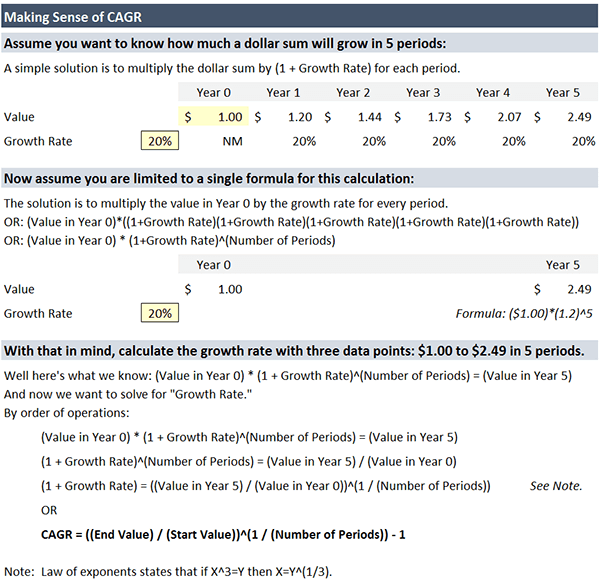
With the definition out of the way we can move on to understanding the formula, and for that purpose I have developed the visual that follows:

