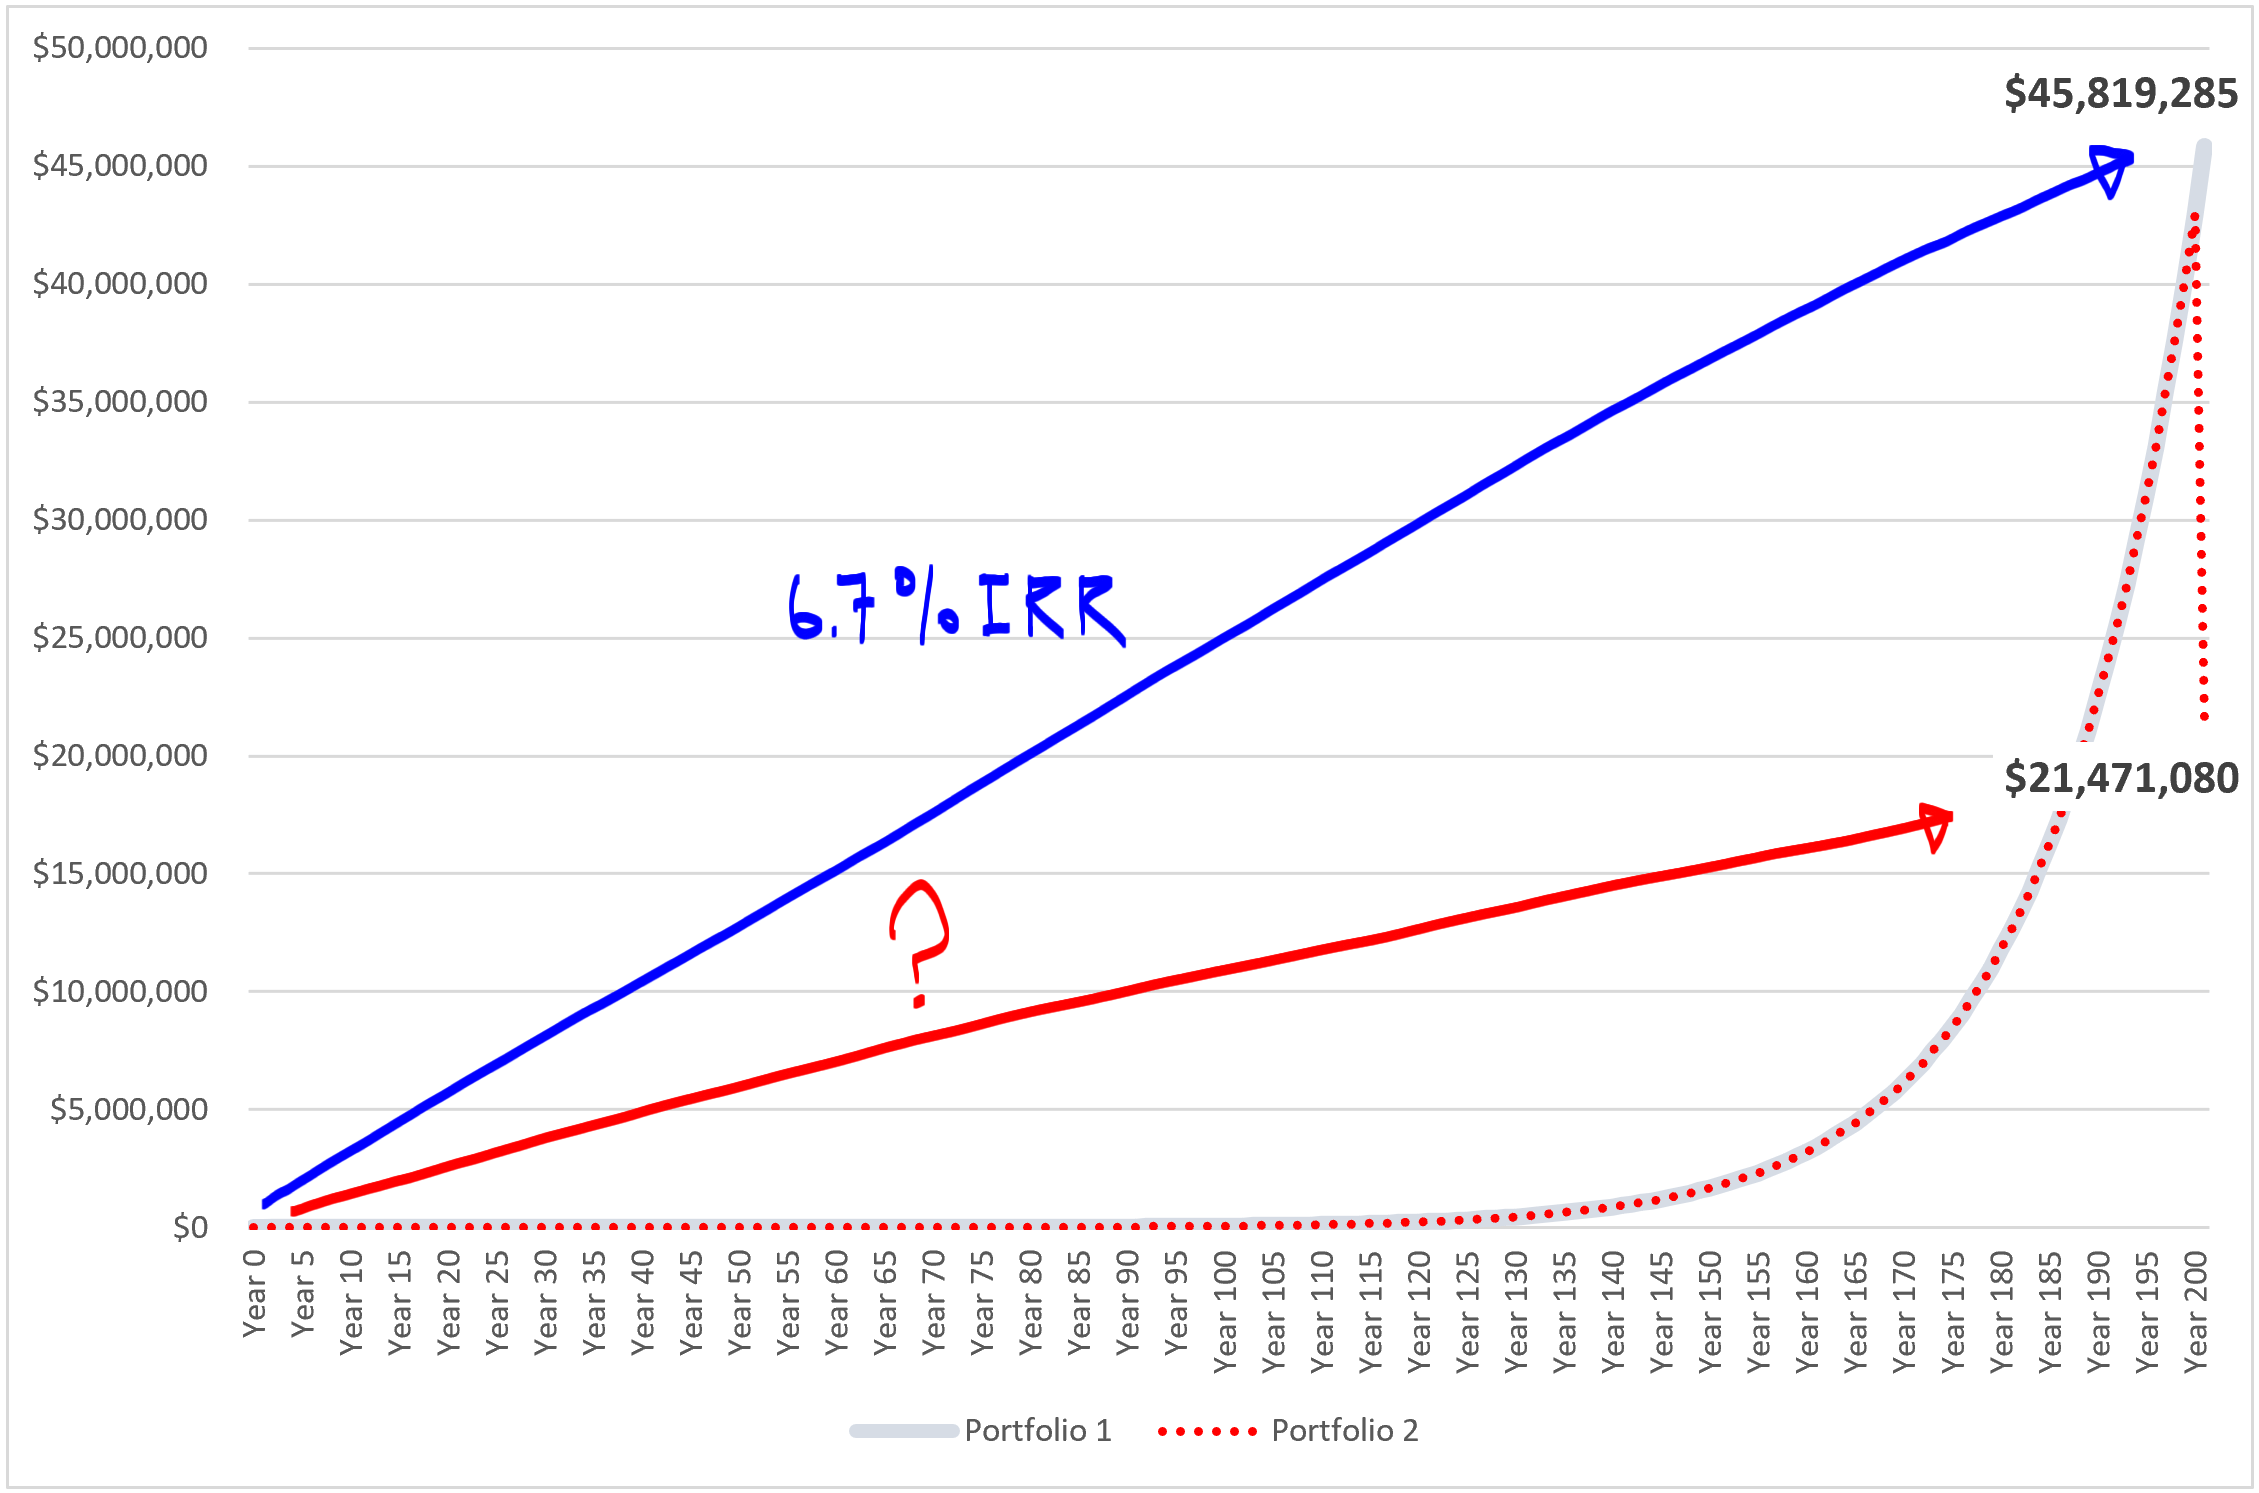
If an investment were to grow by precisely 6.7% each year for 200 years, and then lose half of its value in year 201, how would the investment record change?
An article by Jim Grant, one of my favorite financial writers and analysts, highlighted this excellent thought exercise which provides an entertaining way to explore the difference between the two most commonly cited measures of investment performance: the internal rate of return (IRR) and the multiple on invested capital (MOIC). From the article:
“Take that 200-year, 6.7% compound real return which [Jeremy Siegel, author of Stocks for the Long Run] first electrified the reading portion of Wall Street in 1994. …how would the record change if, in year 201 the market fell by 50%?”
To provide some context, if a $100 investment achieved a 6.7% compound real return for 201 years the value of that investment at the conclusion of 201 years would be approximately $46 million. So what would the 201-year compound real return be if the value dropped to approximately $21 million in year 201 instead?

The article continues:
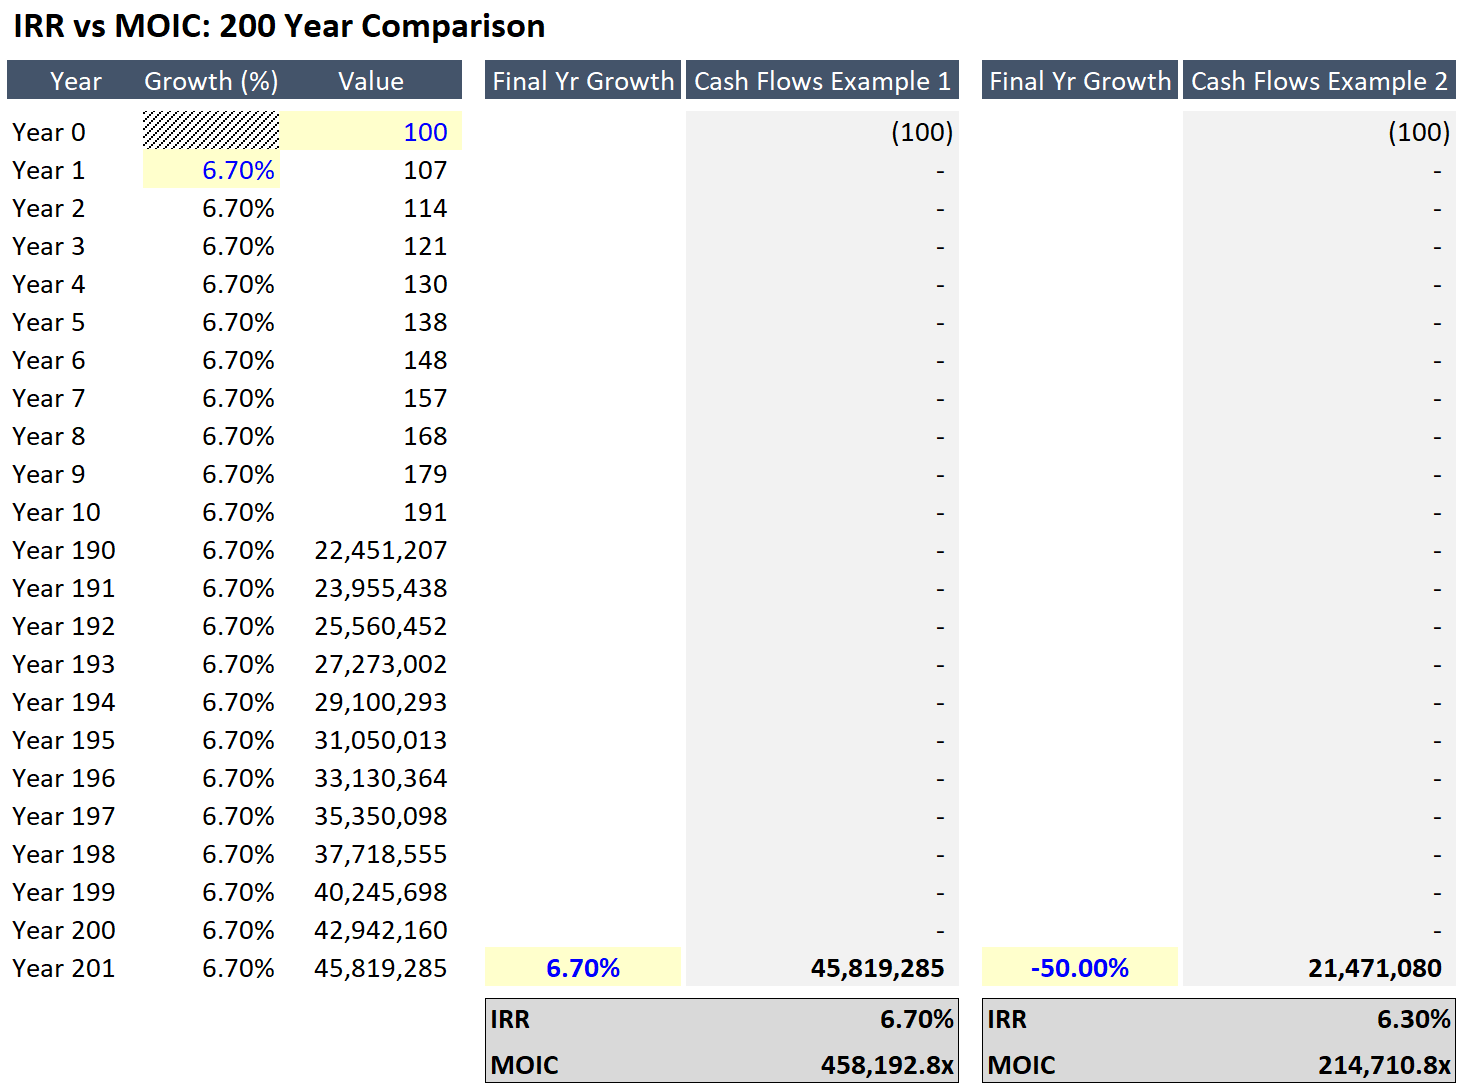
“You suspect that a 50% drawdown would play ducks and drakes with even a two-century performance record, and you confidently say so. But you are wrong: In fact, that seeming disaster would reduce it merely to 6.3%, a scant 40 basis points.”
It is a surprisingly small discrepancy, and I wanted to use this as an opportunity to demonstrate the massive discrepancy in MOIC between the same two scenarios. The spreadsheet visible below can be downloaded here.

Comparing these two scenarios against one another, you will notice that the MOIC is less than half in the second scenario, but the IRR for the cash flows suggests little has changed. It goes to show that an investment’s time horizon is the reason that both of these metrics should always be considered when evaluating performance.
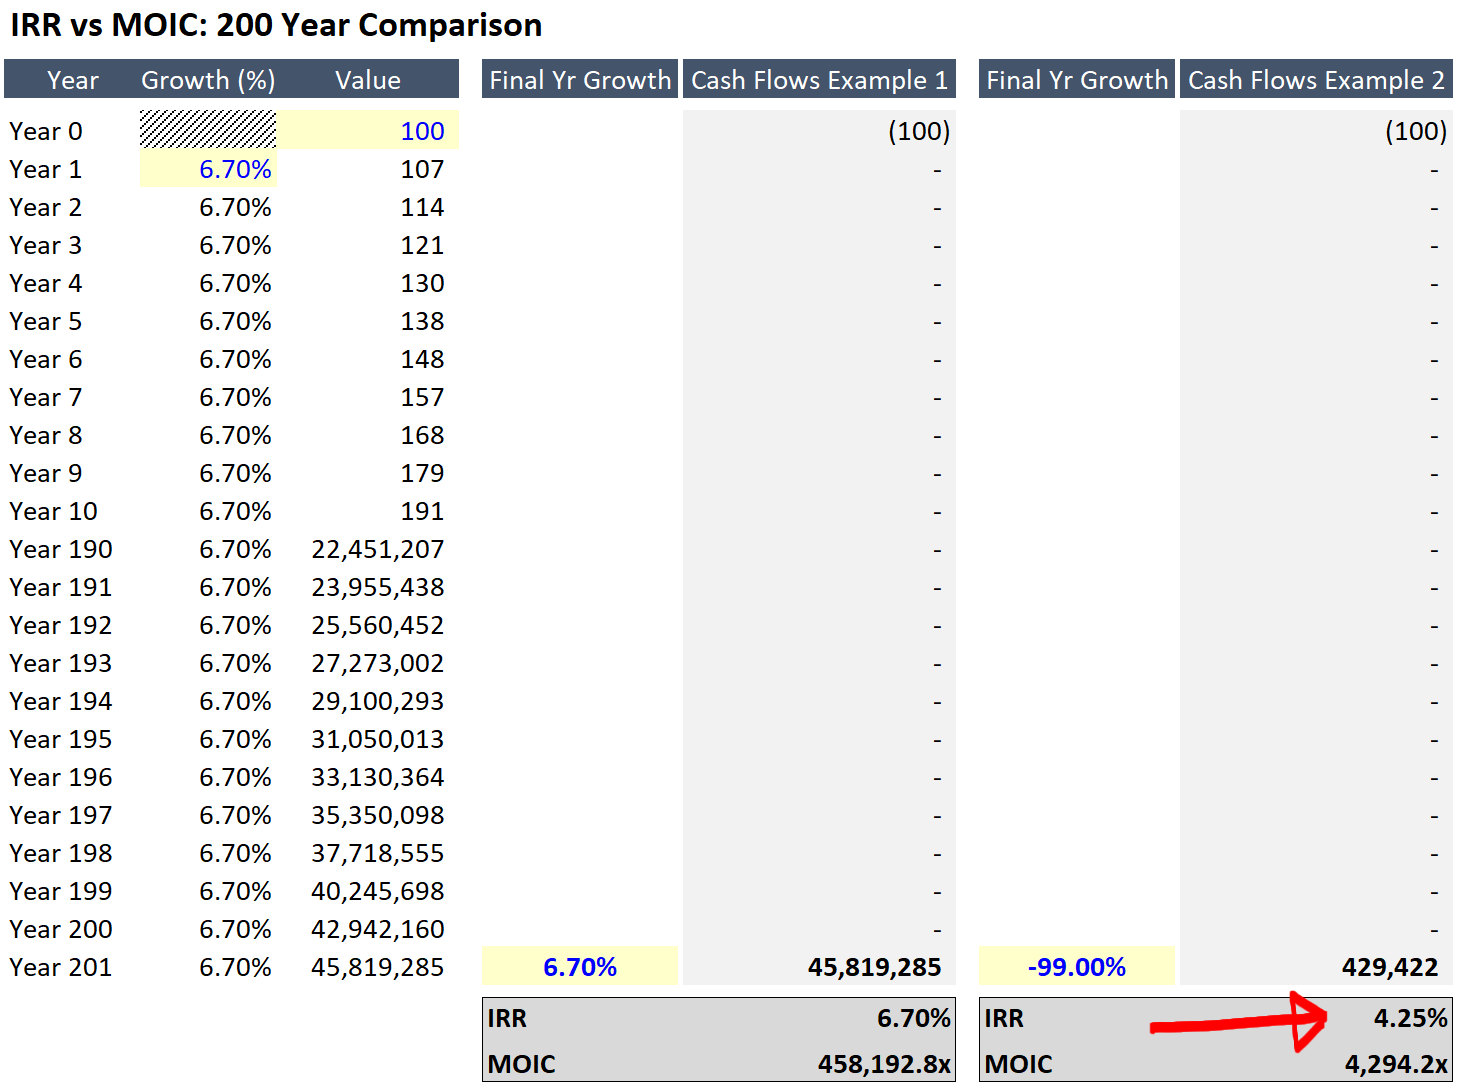
To take the point a step further, imagine if in year 201 the investment lost 99% of its value. How drastic would you expect the difference to be in the event that an investment’s value is all but wiped out? A 99% loss in year 201 after growing at 6.7% for the prior 200 years would result in an internal rate of return of 4.25% for the entire investment period. In stark contrast, the value of the investment would be $429,422 versus $45,819,285 had it just continued to grow at 6.7% in year 201 (download the template if you would like to make this change yourself).

Jim Grant wrote the article to demonstrate that “stocks, as measured over generations, appear invincible.” But I thought it also provided an excellent opportunity to demonstrate why IRR and MOIC should be used in tandem to measure investment performance. While it is clearly an extreme example, I find that extremes can occasionally help communicate valuable lessons.