Imagine that you own a business that generates $1 million dollars of free cash flow each year. This cash is distributed annually and lands in your bank account. We will further imagine that you don’t even have to work as an employee at this business. You are the sole shareholder and chairman, and you have employed a talented CEO who has your trust. What an ideal situation.
What would someone have to offer you to part with this business? Since the business generates $1 million dollars of free cash flow each year, you certainly wouldn’t part with it for that amount. But what about a multiple of that amount?
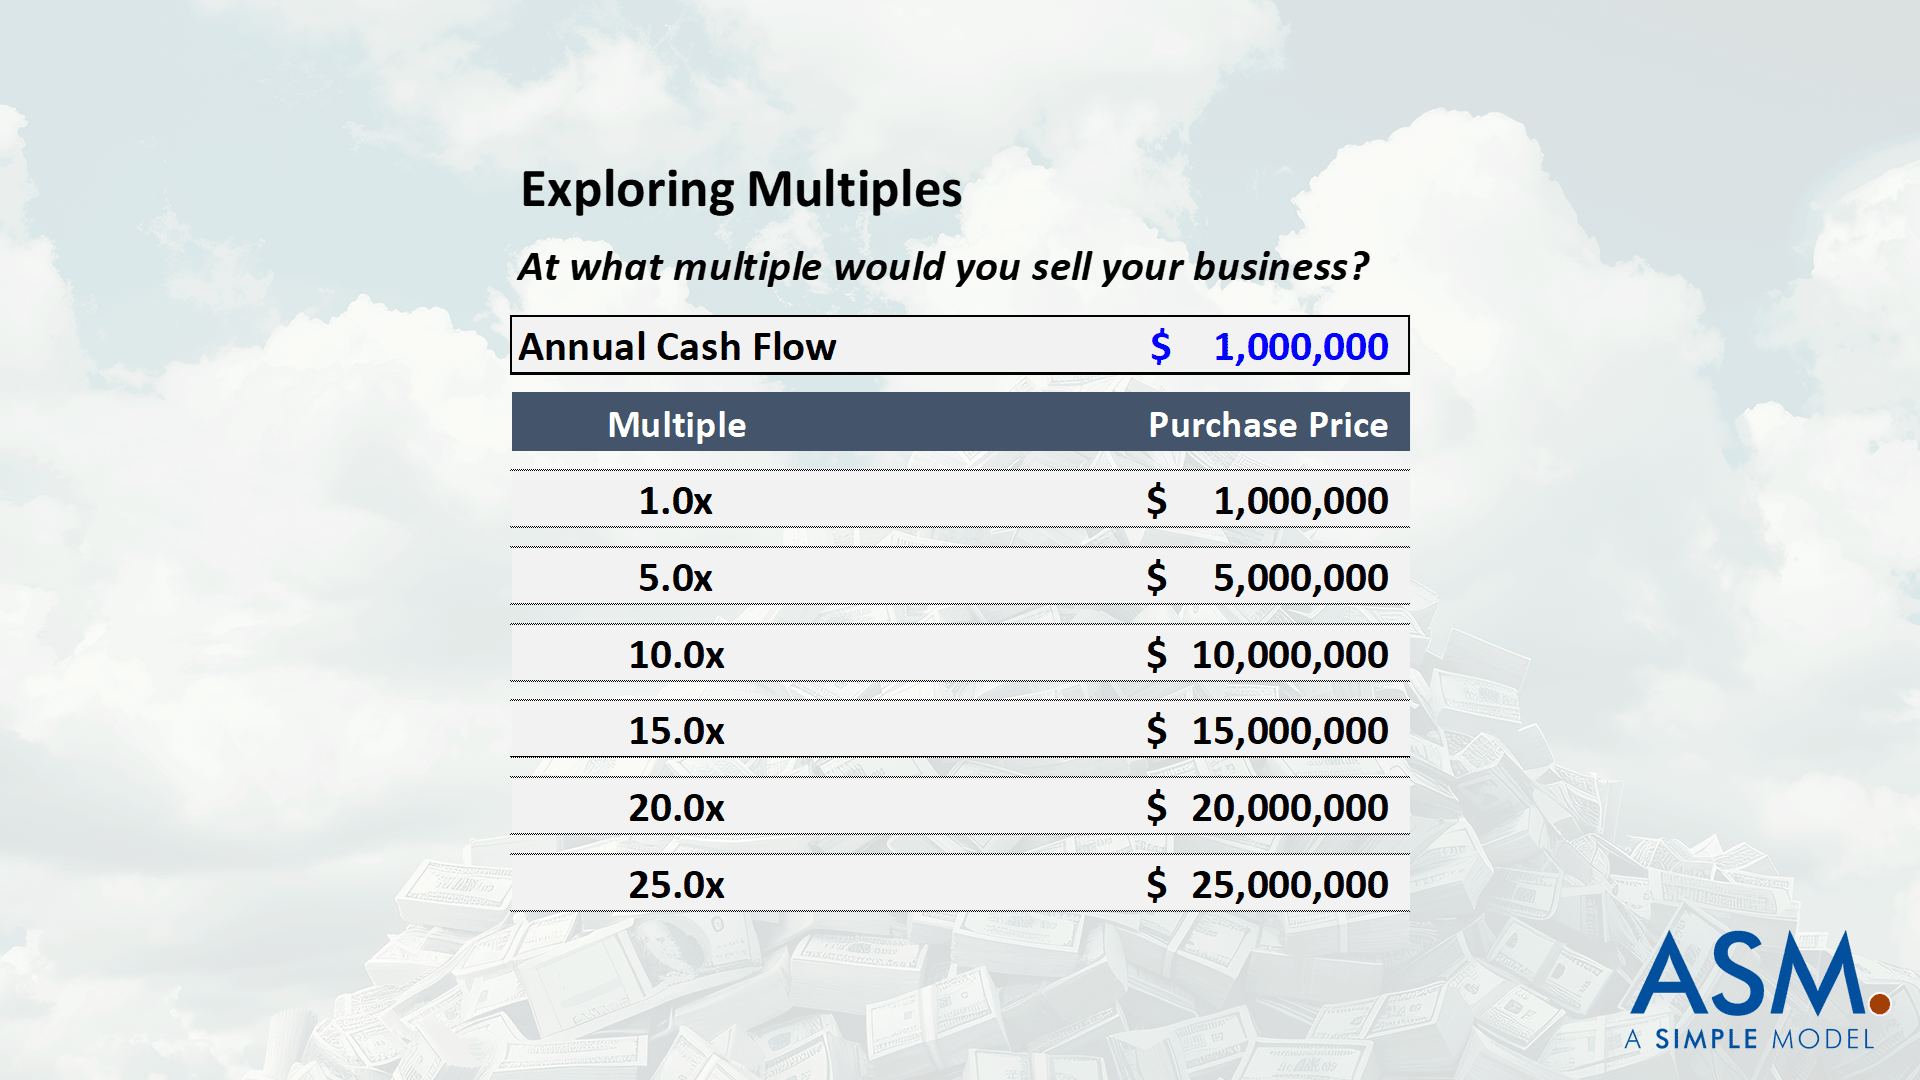
Would you part with it for 5 times the $1 million dollars received each year? How about 10 times? Eventually the multiple becomes too compelling, and a large cash windfall today outweighs the promise of future cash flows. But how do you know what that multiple is?
Pause and try to think through it. Without any other information, what is the lowest multiple you would accept for this fantasy of a company? Remember this number, we will revisit it shortly.
Multiple Logic
Let’s quickly think through this “multiple” concept. We are applying a multiple to the company’s free cash flow because we expect more free cash flow in future years. So, this multiple is attempting to arrive at a value that properly compensates you for the value of all future cash flows today.
In other words, the multiple represents the present value of future cash flows. So, let’s create a projection to determine what this company is worth. Our example makes the projection quite simple. In the image that follows you will see $1 million projected through the “Last Year Ever.”
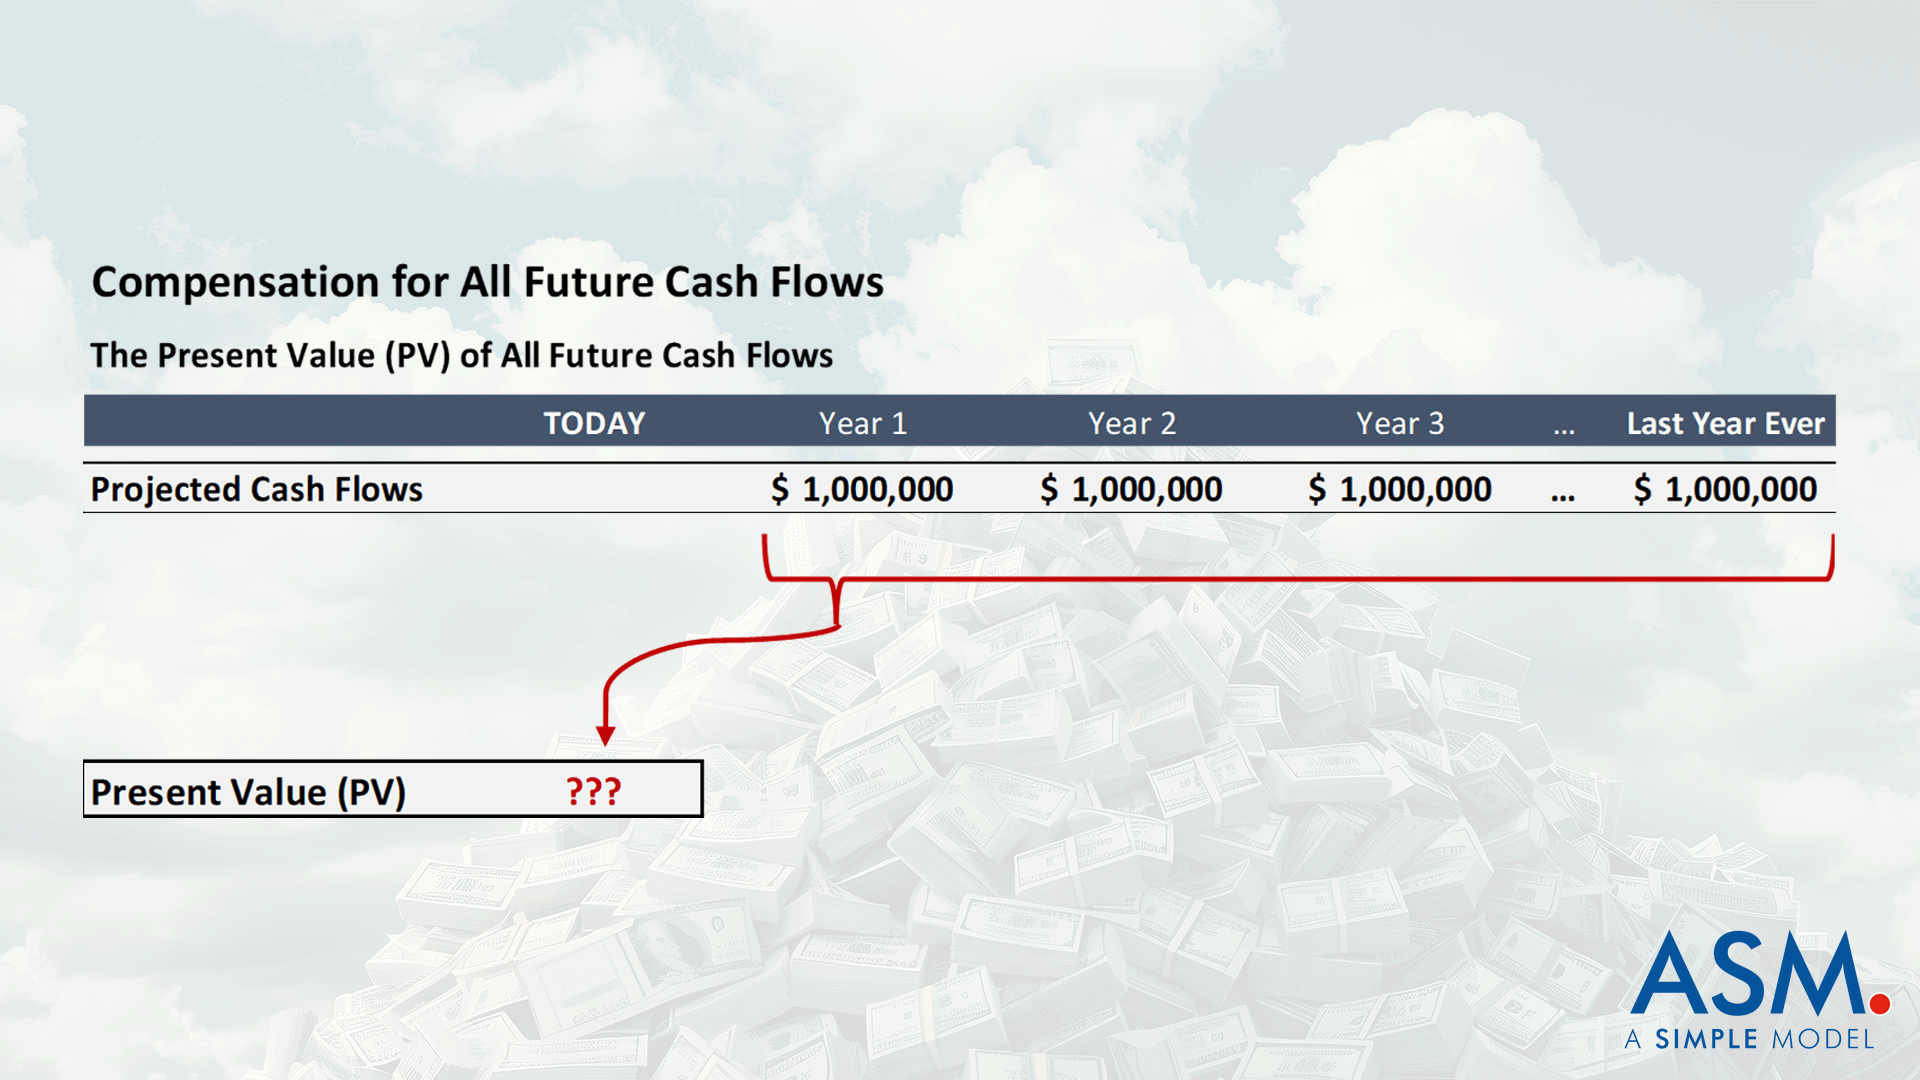
It follows that the primary challenges surrounding valuation for an asset that generates cash are twofold:
- projecting the company’s cash flows into the future;
- and determining the value of these cash flows today.
Fortunately, this fantasy company of yours will always generate $1,000,000 of cash flow per year. So, we can focus on item 2 for now.
The Value of Future Cash Flows
Projecting annual cash flow of $1,000,000 seems absurd. The value is infinite (or at least $1 million dollars times 5 billion years when the Sun explodes…). But a dollar today is not worth a dollar one year from now. There are two reasons for this:
- inflation eats away at purchasing power;
- and you miss out on investment opportunities available to you.
So, we need to determine the minimum return you would require to wait one year to receive one million dollars. This minimum return is your cost of capital, and since you don’t want to change your lifestyle of leisure, we’re going to assume that your cost of capital is the return you believe you could achieve by investing passively in a low-cost index fund. For the purpose of this exercise, let’s call it 7.5%.
We will expand on the definition of cost of capital in lessons available on ASM, but for now it is the rate of return you require as an investor. In other words, it provides an answer to the compensation you require to wait one year to receive one million dollars. Conversely, it can also be used to calculate the cost of holding one million dollars without investing it.
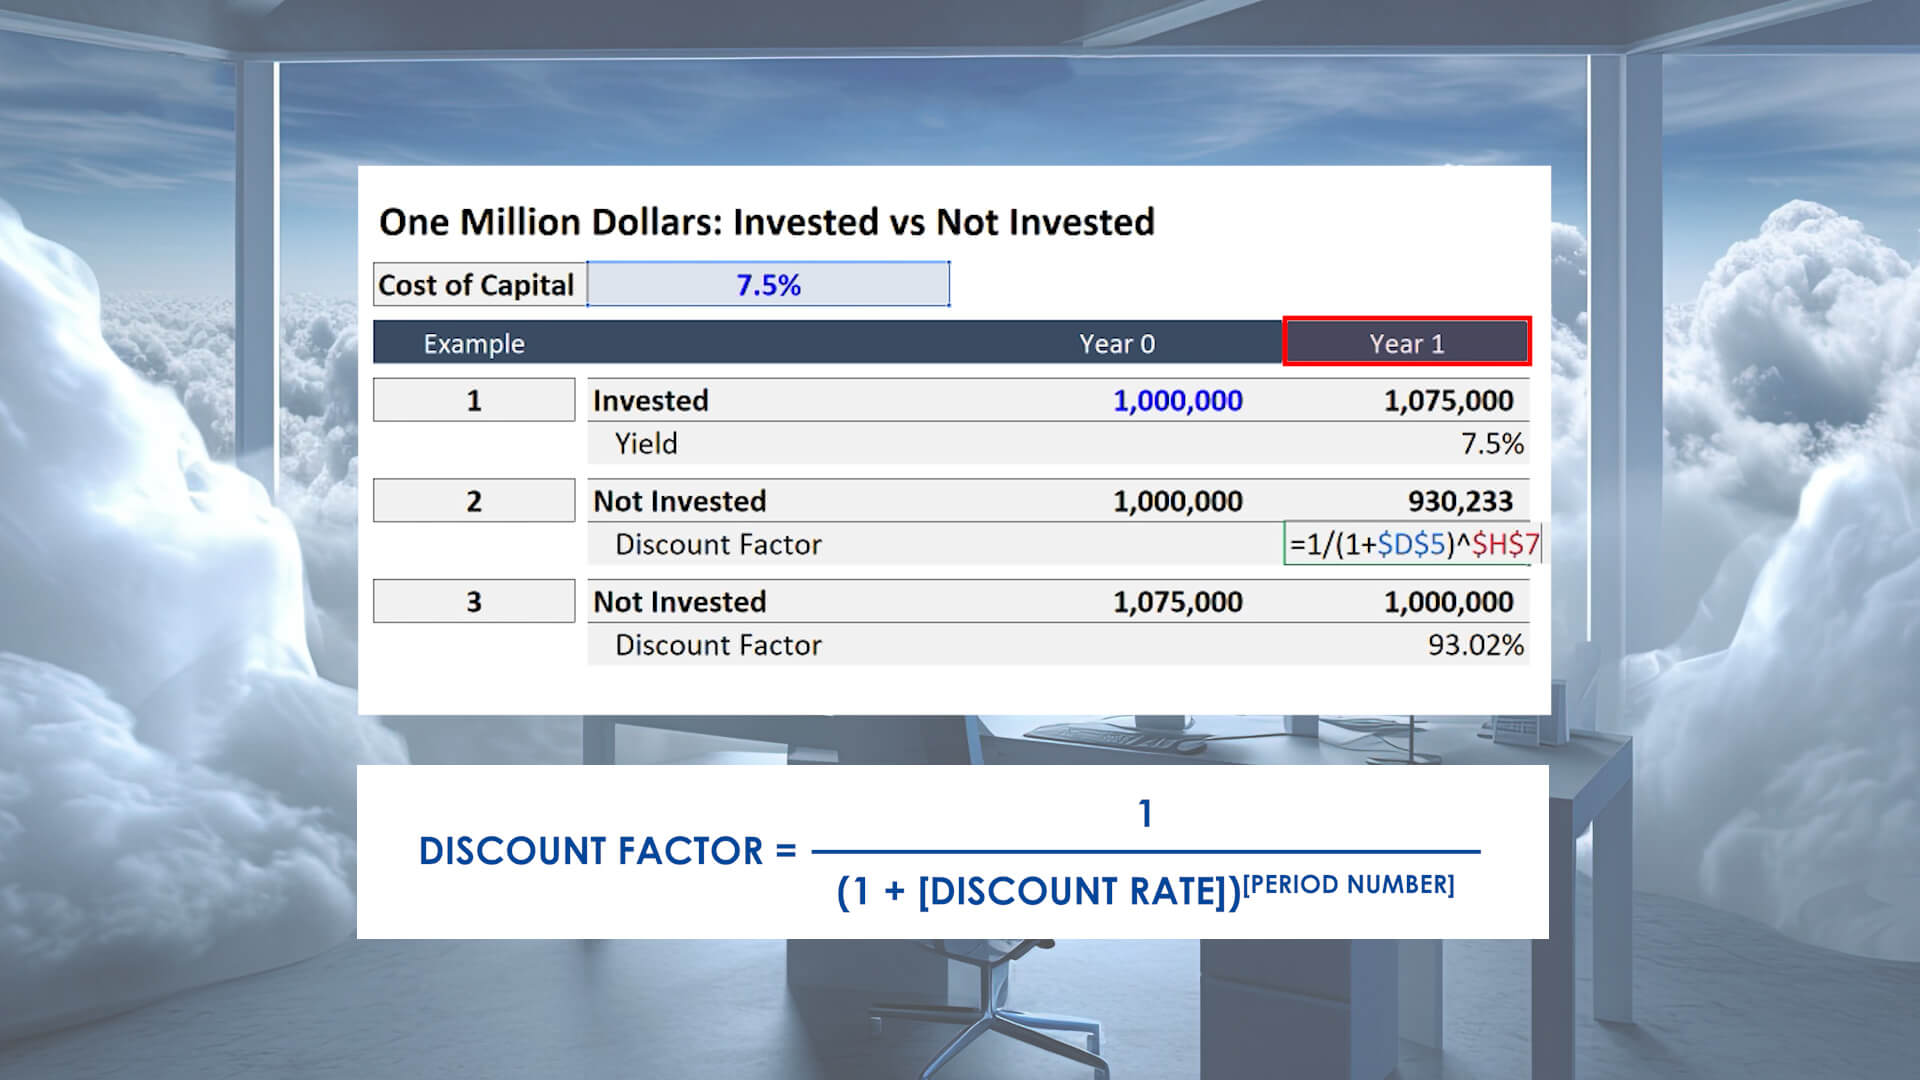
Example 1 in the table above demonstrates that with a cost of capital equal to 7.5%, $75,000 adequately compensates you for waiting one year to receive one million dollars. The logic is simple, if you had it today you would invest it in a low-cost index fund and make a 7.5% return.
The second example demonstrates what one million dollars is worth to you one year from today. The time spent un-invested would result in a discount, and ultimately it would only be worth 93.02% of the original amount. The third example has been included to demonstrate that this math works perfectly both ways: Apply the discount factor of 93.02% to the growth realized in year 1 of example 1, and the result is $1 million.
In the example above, the 93.02% is known as the discount factor, and it is calculated with the equation visible in the image. Per the formula, the time period is an important variable in the discount factor calculation because it causes the discounted amount to increase in each consecutive year. In the image below you will see that in year 4, with a cost of capital of 7.5%, the present value of $1,000,000 drops to $748,801.
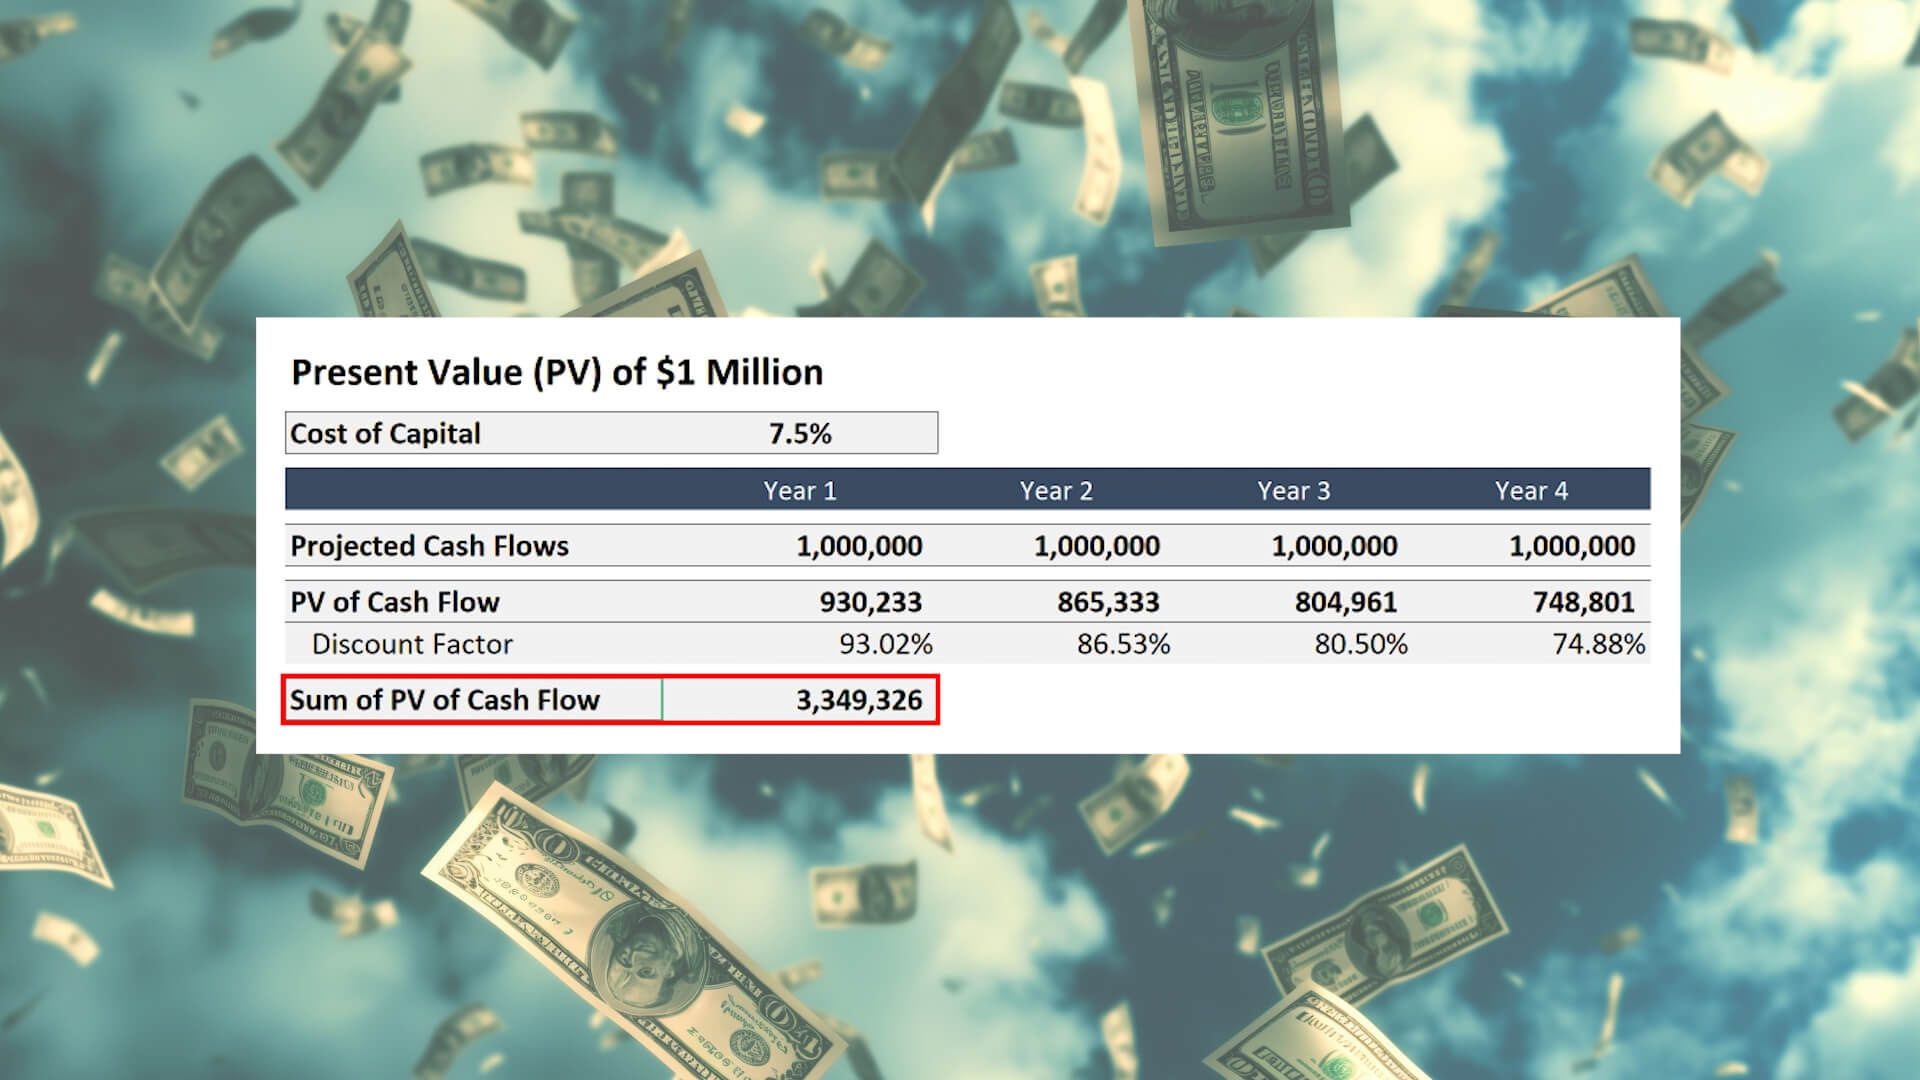
If you sum the present value of each year’s projected cash flow, you arrive at a value of $3.3 million, which is what you would likely accept for this business if you knew with certainty that it would evaporate on the last day of year 3. But this magic company, which is otherwise not exposed to risk, will make precisely $1 million each year forever.
Eventually, however, the present value of any static cash flow stream falls to zero (assuming a cost of capital greater than 0%). You have to project well into the future to see this happen, so let’s limit this exercise to the point at which the cash flow stream drops below a single cent. With a cost of capital equal to 7.5%, that happens in year 265 per the image below.
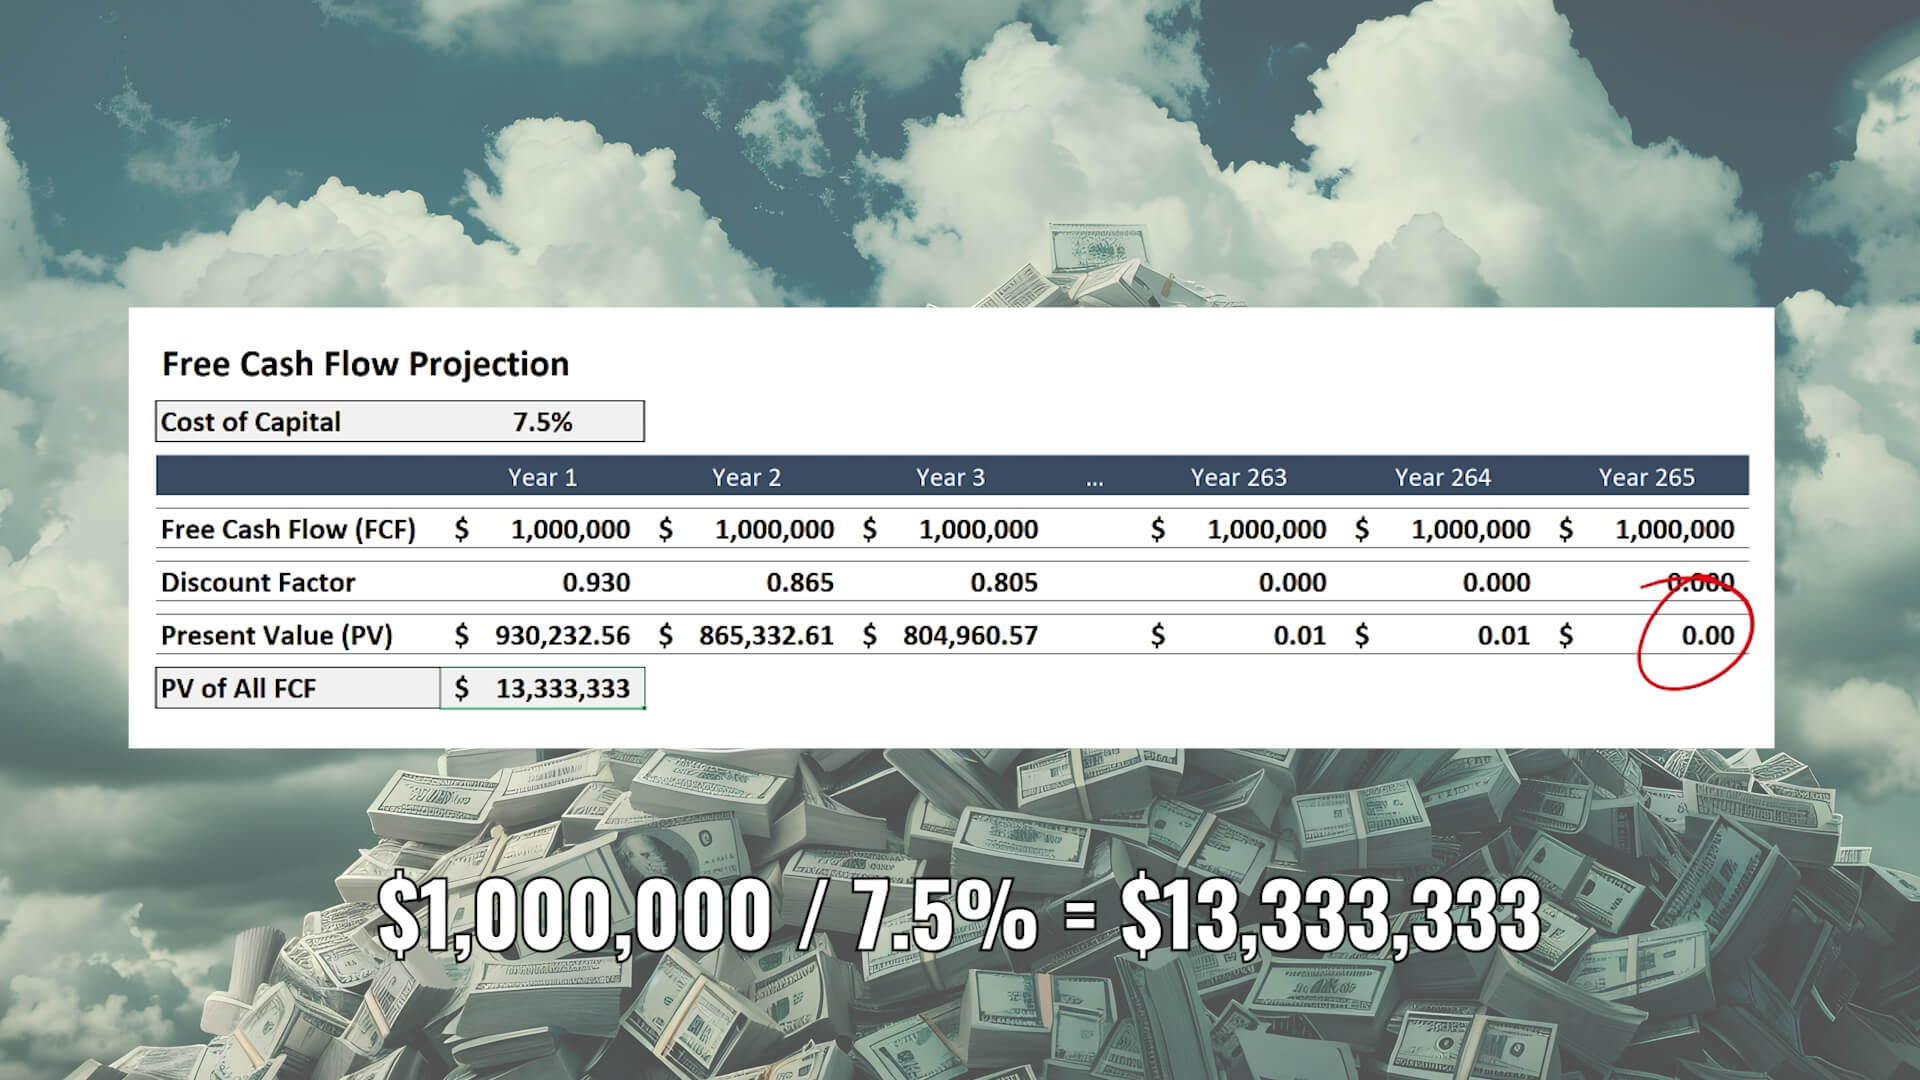
If we repeat the exercise and sum the present value of all 265 years of future cash flows, you arrive at a value of $13.3 million dollars.
Now some of you mathematicians reading this may be thinking, “listen idiot, you could have arrived at that value by dividing $1 million by your cost of capital.” That’s true. But then we wouldn’t have built this very simple discounted cash flow model. And this kind of math substitute only works for a perfectly static and predictable future, which is impossible in the real world. When the amount of cash flow changes from year to year, that quotient won’t produce the same result, and the discounted cash flow model framework we just walked through will be helpful.
At the moment, however, we have our answer: You would sell this fantastic company for 13.3x free cash flow of $1 million or $13.3 million.
How does that multiple compare to your original guess? Were you above or below this figure?
What’s the Point?
The point is that there are generally three approaches to valuing a company, and we just superficially discussed two of them. The third is even simpler, and collectively they can be summarized as follows:
- Multiples: Valuation expressed as a multiple of a measure of profitability.
- Discounted Cash Flow: Calculating the present value of a company’s future cash flows.
- Cost: Summing the value of a company’s assets (more precisely, net assets).
The cost-approach is largely ignored for healthy growing companies because businesses learn to turn a collection of assets, knowledge, proprietary processes and people into cash printing machines. In other words, think of it as the valuation floor for a healthy business.
Of the three, most of the investment community relies on multiples because discounted cash flow models for real companies require “too many inputs.” While DCF models do require a lot of inputs, this opinion would be wildly unpopular at a valuation firm or investment bank.
That said, most thorough valuation exercises involve using a weighted average of the first two options listed. Within the first option, two types of multiples are generally used.
- Transaction Multiples: The multiples paid for similar companies in M&A and private equity transactions.
- Publicly Traded Multiples: The multiples for similar companies trading in the stock market.
In this example we used cash flow, but it is more common to see valuation expressed as a multiple of revenue, EBITDA, EBIT or earnings per share. The metric chosen will have a huge impact on the multiple. As you might imagine, for the same company a multiple of revenue will be much lower than a multiple of EBIT.
It’s important to note that a multiple is making assumptions for the detail you would find in a discounted cash flow model. At the moment, it’s hard to know what this detail is because our first DCF was so simple, but you can learn more about DCF models in the lessons available on ASM. The purpose of this of this post is just to provide a high-level overview of valuation basics.