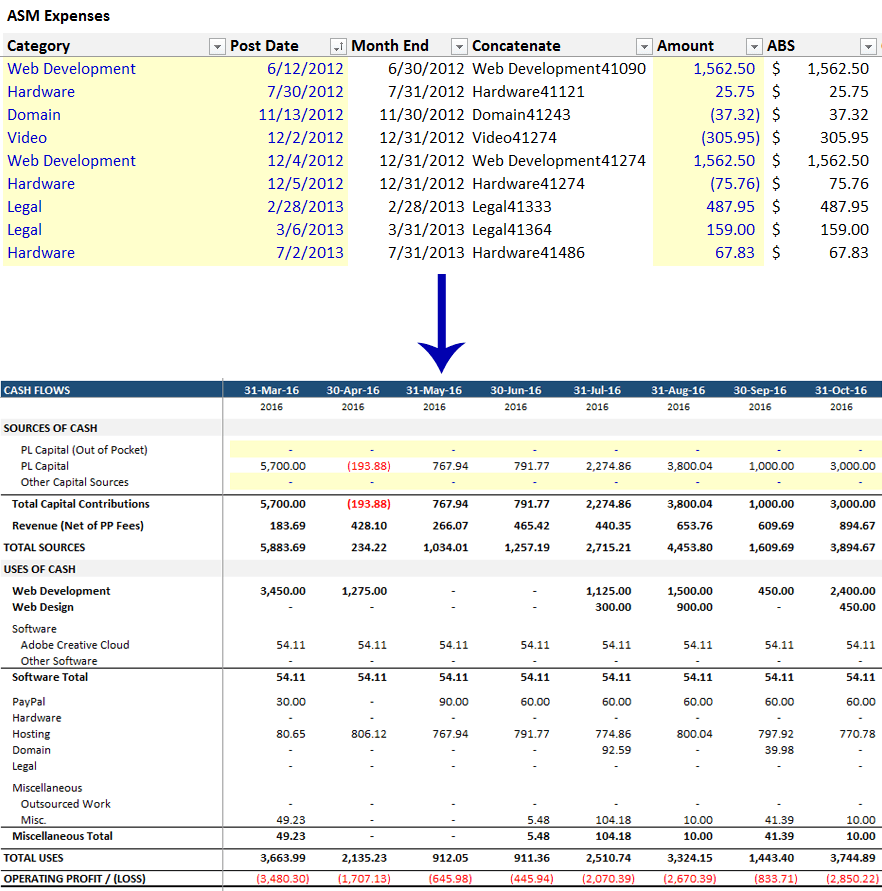
For the uninitiated, ASM has a video series showcasing the business model behind this website. In this series you will learn how to organize real revenue and expense data, and transform it into useful information. The image below shows this first step (click to enlarge).

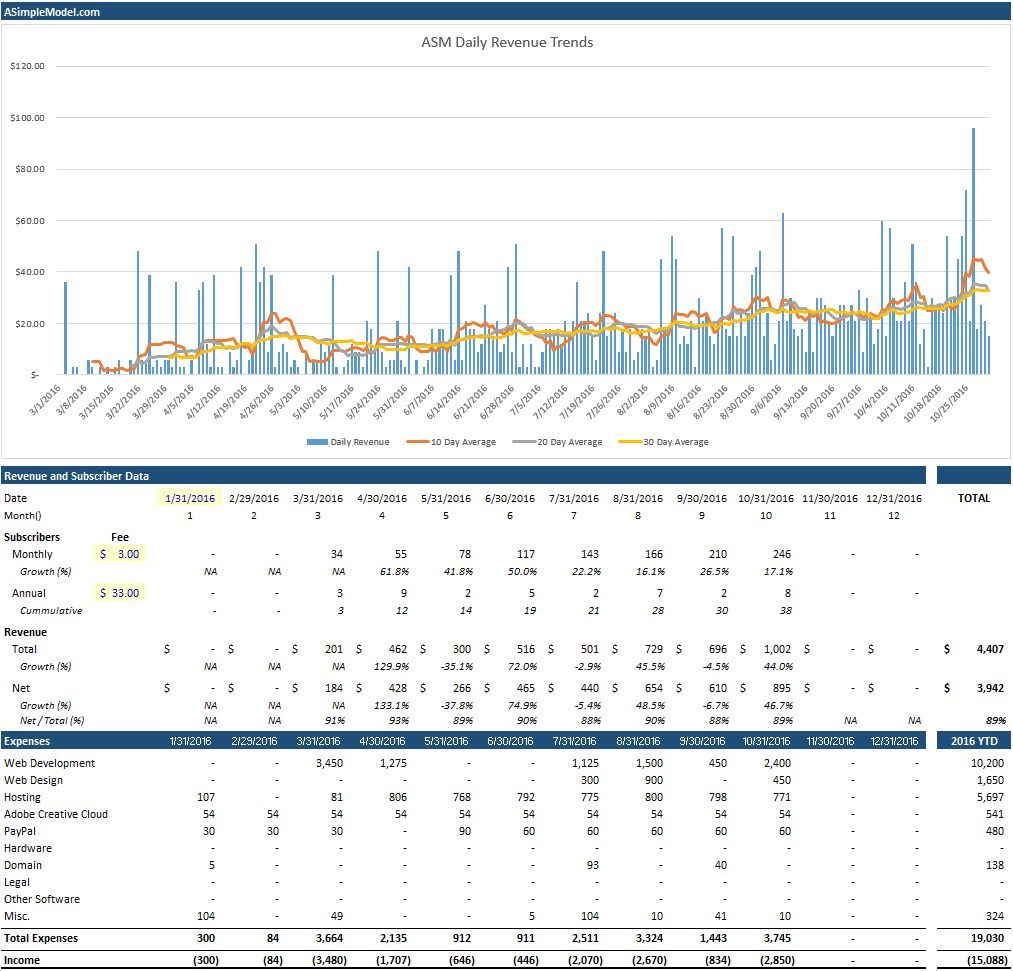
Once we have all data organized longitudinally by revenue or expense category, the next step is to develop a business dashboard. To date we have developed a template with the following information:
- Daily Revenue
- Monthly Subscriber Count
- Monthly Revenue
- Monthly Expense Data
- Profit / (Loss)
- Investment to Date
All of this information fits on one page, a portion of which is visible below (click on the image for an enlarged view).

